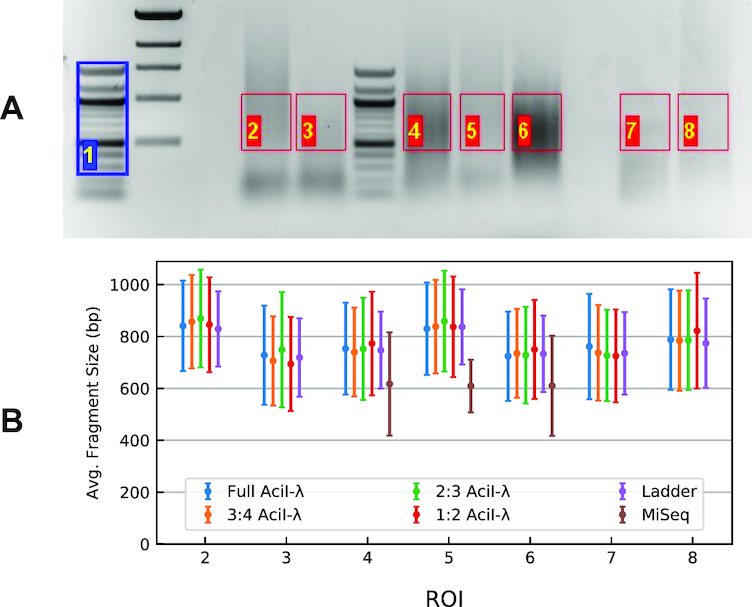
Figure 5.

Data used to examine the effect of fragment-density test. (A) The gel was analyzed considering the portions delimited by the ROIs, using lane 1 (blue) as the reference ladder. ROIs 2–6 are tagmentation products of human genomic DNA; 7 and 8 are λ-AciI digest samples (B). Summary plot of the fit for the gel in panel (A). Fragment-size mean and standard-deviation values for model distributions containing varying numbers of reference fragments (peaks). Symbols are colored according to the proportion of the original λ-AciI basis fragments retained in the reference distribution; thus, 1:2 means that every other peak was eliminated from the fit, 2:3 every third peak etc. Data are also reported in Supplementary Table S4.
