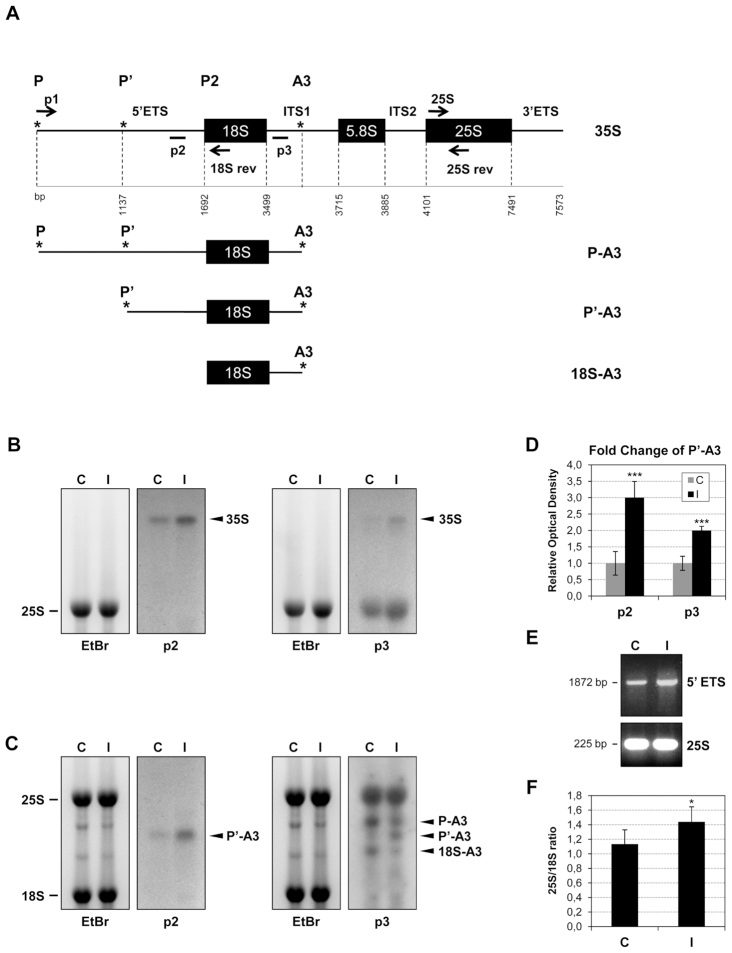
Figure 4.
CEVd produces alterations in the rRNA processing of tomato plants. (A) Scheme of tomato pre-rRNA indicating the priming sites for the Northern probes (p2 and p3) and the primers used for the RT-PCR experiment (arrows; p1, 18Srev, 25S and 25Srev). The tomato GENBANK sequences used were the following ones: complete rRNA (X52215), 18S sequence (X51576), 5.8S sequence (X52265) and 25S sequence (X13557). Initiation and processing sites are marked with asterisks (*) according to Perry et al. (1990). The scheme was adapted from Missbach et al. (55). (B) RNAs from control (C) and CEVd-infected (I) tomato leaves were separated on an agarose-formadehyde gel, stained with ethidium bromide (left) for visualization of the mature 25S rRNA and then Northern hybridization was performed with the probes p2 or p3 (right) in order to detect the 35S pre-RNA. (C) RNAs from control (C) and CEVd-infected (I) tomato leaves were separated on an agarose gel, stained with ethidium bromide (left) in order to visualize the mature 25S and 18S rRNAs and then Northern hybridization was performed with the probes p2 or p3 (right) in order to detect the pre-rRNAs. (D) The quantification of P’-A3 in both control (C) and CEVd-infected (I) tomato RNAs was performed with at least 3 biological replicates. The values are represented as the mean ± SD. The triple asterisk (***) indicates statistically significant differences between the control and the treated plants with P < 0.001. (E) RT-PCR from control (C) and CEVd-infected (I) tomato leaves. The RT reactions were performed with the 18Srev primer. The PCRs were performed with either primers p1 and 18Srev (1872 pb, upper panel) or 25S and 25Srev (225 bp, lower panel). A representative gel of the RT-PCR fractionation is shown. (F) Total RNAs from control (C) and CEVd-infected (I) tomato leaves were resolved on a Bioanalyzer and the 25S/18S ratios were calculated. 25S/18S ratios are represented as the mean ± SD of at least three biological analyses. The asterisk (*) indicates statistically significant differences between the control and the treated plants with P < 0.05.

