Figure 5.
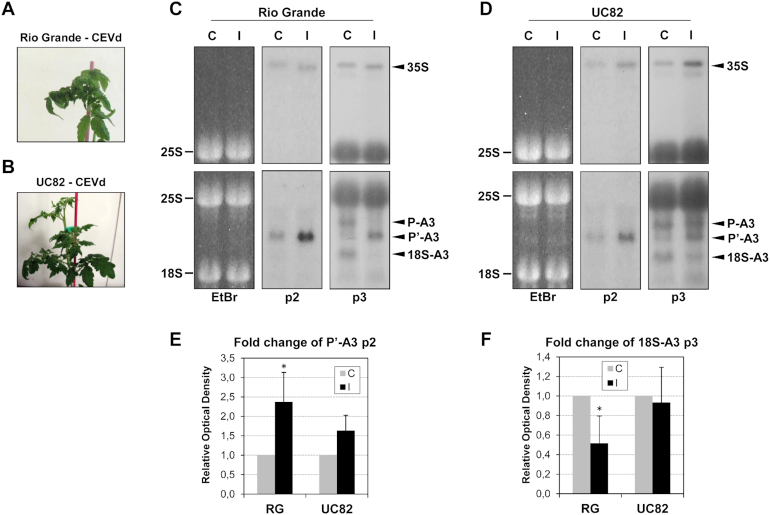
Alterations in tomato rRNA processing correlate with CEVd symptomatology. (A) Representative severe symptomatology displayed by CEVd-infected Rio Grande tomato plants. (B) Representative mild symptomatology displayed by CEVd-infected UC82 tomato plants. (C) RNAs from Rio Grande (RG), control (C) and CEVd infected (I) tomato leaves were separated on an agarose-formadehyde gel, stained with ethidium bromide (left) for visualization of the mature 25S and then were Northern blot analyzed with probes p2 or p3. (D) The RNAs from UC82 control (C) and CEVd infected (I) tomato leaves were separated on an agarose-formadehyde gel, stained with ethidium bromide (left) for visualization of the mature 25S and then were Northern blot analyzed with probes p2 or p3. (E) The quantification of P’-A3 was performed with at least 3 biological replicates in control (C), CEVd infected (I), Rio Grande (RG) and UC82 (UC82) tomato plants. The relative values are represented as the mean ± SD. The asterisk (*) indicates statistically significant differences between the control and the treated plants with P < 0.05. (F) The quantification of 18S-A3 was performed with at least three biological replicates in control (C), CEVd infected (I), Rio Grande (RG) the UC82 (UC82) tomato plants. The relative values are represented as the mean ± SD. The asterisk (*) indicates statistically significant differences between the control and the treated plants with P < 0.05.

