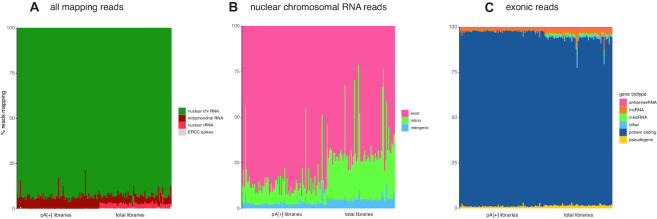
Figure 2.
Read distribution differs between polyA[+] and total RNA libraries. (A) Percentage of reads derived from nuclear RNA, mitochondrial RNA and ribosomal RNA per cell quantified with STAR. (B) Percentage of the reads originating from nuclear chromosomes derived from exonic, intronic and intergenic regions per cell quantified with STAR. (C) Percentage of exonic reads attributed to the different biotypes per cell quantified with Kallisto.

