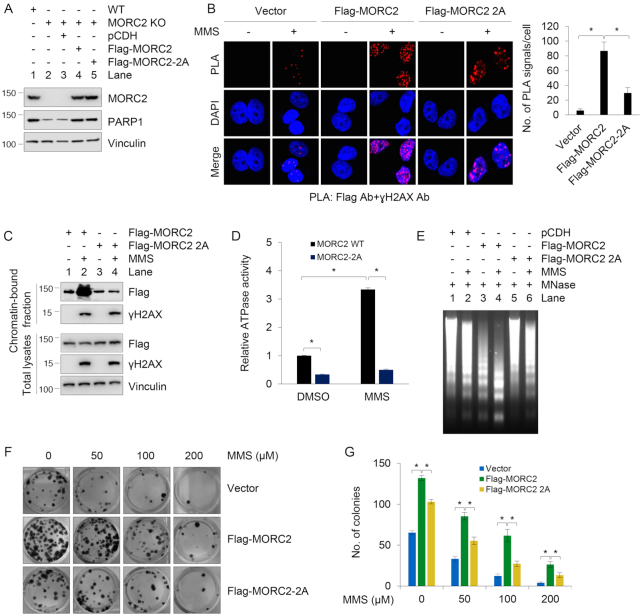
Figure 5.
PARP1 recruits MORC2 to DNA damage sites and PARylation of MORC2 stimulates its chromatin remodeling activities. (A) Reconstitution of MORC2 KO MCF-7 cells with Flag-MORC2 and Flag-MORC2–2A by lentiviral infection. Expression status of exogenous and endogenous MORC2 was validated by immunoblotting. (B) MCF-7 KO cells stably expressing pCDH, Flag-MORC2 and Flag-MORC2–2A were treated with or without 1 mM MMS for 30 min, and then subjected to in vivo PLA assays with indicated antibodies. Three independent experiments were performed, and total 50 cells were counted for each experiment. (C) MCF-7 KO cells stably expressing Flag-MORC2 and Flag-MORC2–2A were treated with or without 1 mM MMS for 30 min, and subjected to cellular fractionation as described in ‘Materials and Methods’ section. Chromatin-bound fractions and total cellular lysates from undamaged and DNA damaged cells were immunoblotted with the indicated antibodies. (D) MCF-7 KO cells stably expressing Flag-MORC2 and Flag-MORC2–2A were treated with or without 1 mM MMS for 30 min. Immunoprecipitated Flag-MORC2 or Flag-MORC2–2A was subjected to ATPase assays using the ATPase/GTPase Activity Assay Kit (Sigma). Data represent mean ± s.d. from three biologically independent experiments. (E) MCF-7 KO cells stably expressing pCDH, Flag-MORC2 and Flag-MORC2–5A were treated with or without 1 mM MMS for 30 min. Isolated nuclei were subjected to MNase assays as described in ‘Materials and Methods’ section. (F and G) MCF-7 KO cells stably expressing pCDH, Flag-MORC2 and Flag-MORC2–2A were treated with or without increasing doses of MMS for 2 weeks. The representative images of Crystal Violet-stained colonies are shown in F. Quantitative results (G) are represented as mean ± s.d. as indicated from three independent experiments; *, P<0.05.

