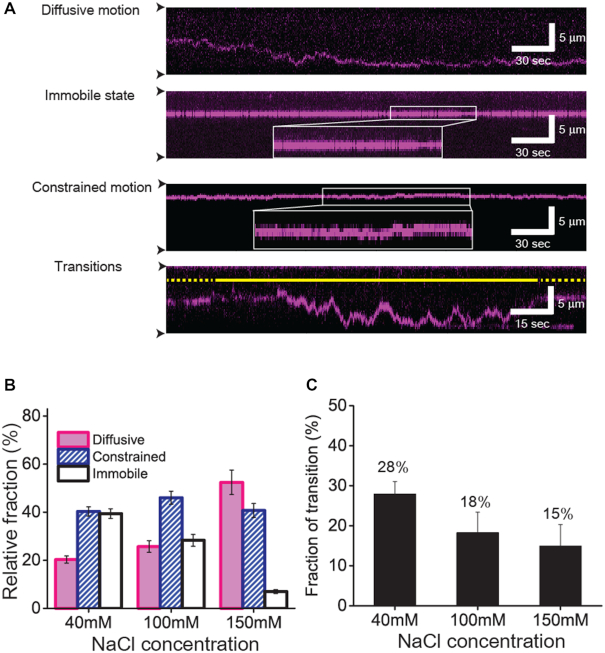
Figure 2.
Three distinct types of motion of XPC-RAD23B on undamaged DNA (A) Kymographs for different types of motion of XPC-RAD23B. From top to bottom, diffusive motion, immobile state, constrained motion and transition between two distinct states are displayed. The white box in the kymographs showing the immobile state and constrained motion represents the zoom-in view of trace. The constrained motion is clearly distinguished from the immobile state. The solid and dotted yellow lines stand for diffusive motion and constrained motion, respectively. The black arrow heads indicate barrier positions. (B) Relative fraction of each motion according to salt concentration. The error bars were obtained by the standard deviation of multinomial distribution. (C) Relative fraction of transitions out of total traces according to salt concentration. The error bars were obtained by the standard deviation of binominal distribution.

