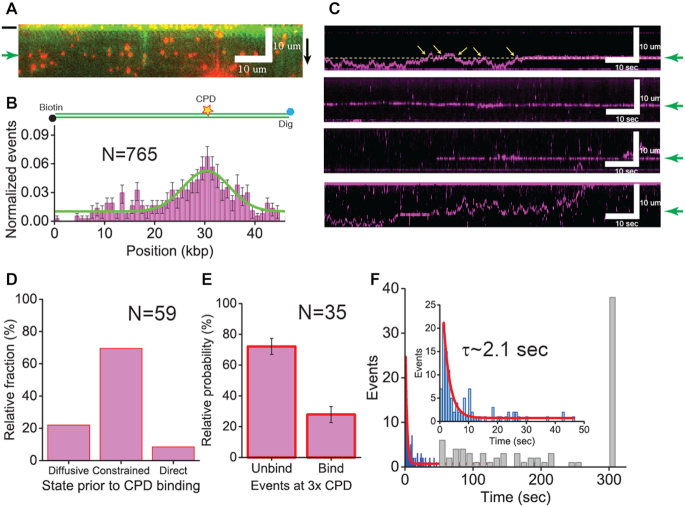
Figure 5.
XPC-RAD23B on the damaged DNA (A) Snap shot of single-tethered DNA curtain for the specific binding of XPC-RAD23B on CPD-modified λ-DNA. XPC-RAD23B molecules (red) are aligned at CPD sites (green arrow) on YOYO-1 stained λ-DNA (green). The black bar next to the image indicates the barrier position. The black arrow represents the flow orientation. (B) Histogram for binding positions of XPC-RAD23B on CPD-inserted λ-DNA. The histogram was fitted by a single Gaussian function (solid green line). The peak center is placed at 30.5 ± 3.5 kbp, which is close to the actual CPD location (33.5 kbp). The error bars were obtained by bootstrapping with 70% confidence interval. The yellow star represents the location of CPDs on the λ-DNA. (C) Kymographs showing the search of XPC-RAD23B for CPDs on λ-DNA. Top: CPD recognition by diffusive motion; second: CPD recognition by constrained motion; third: direct binding to CPDs; and bottom: transient binding to CPDs during diffusive motion. The green arrows next to kymographs indicate the location of CPDs. In the top panel, the yellow dashed line is an abstract line for the location of CPDs and yellow arrows represent the events that XPC-RAD23B does not identify CPDs. (D) Relative fraction of diffusive, constrained and direct binding to CPDs by XPC-RAD23B −22.0, 69.5, 8.5%, respectively. The total number of events (N) analyzed for relative fraction was 59. (E) The probability that XPC-RAD23B binds or misses CPDs when encountering the lesions. The binding probability represents CPD recognition efficiency of XPC-RAD23B in diffusive motion at CPDs. The error bar represents standard error. (F) Duration of binding of XPC-RAD23B to CPDs. Lifetimes were collected (blue histogram) and analyzed by fitting with a single exponential decay function (red line). The total number of molecules (N) analyzed for the lifetime was 135. The lifetime (τ) was determined to be 2.1 ± 0.2 s. (Inset) zoom-in view of lifetime histogram. The distribution of binding times, which means by stable binding of XPC-RAD23B to CPDs, is shown in the gray histogram. The total number of molecules (N) analyzed for binding times was 109.

