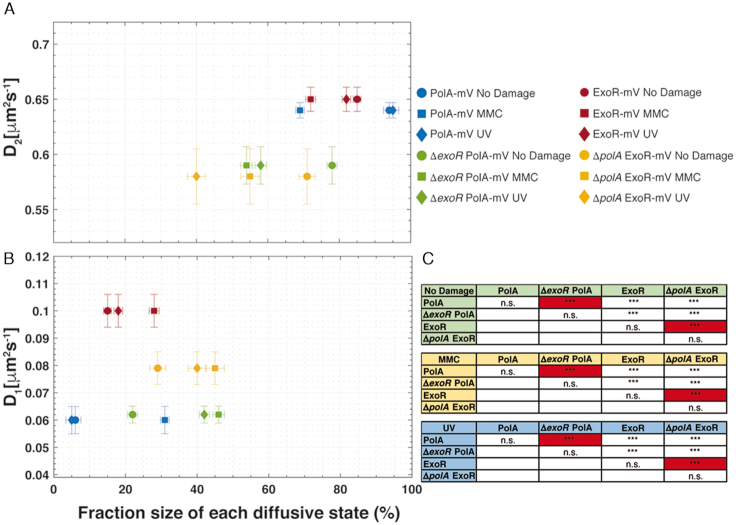
Figure 5.
Scatter plot and significance test results from dynamics and fraction sizes of polymerases. Scatter plot showing the relationship between the diffusion coefficients (Di) of PolA-mV, ExoR-mV, ΔpolA ExoR-mV and ΔexoR PolA-mV (y-axis) and comparison of fraction sizes (x-axis), of (A) fast and (B) slow-diffusing populations. (C) Results of the hypothesis testing to the differences in the fraction sizes of all proteins in terms of P-value: As usual, *, ** and *** stand for P-values lower than 0.1, 0.05 and 0.01, respectively, whilst n.s. stands for statistically not significant. The most relevant comparisons are highlighted in red.

