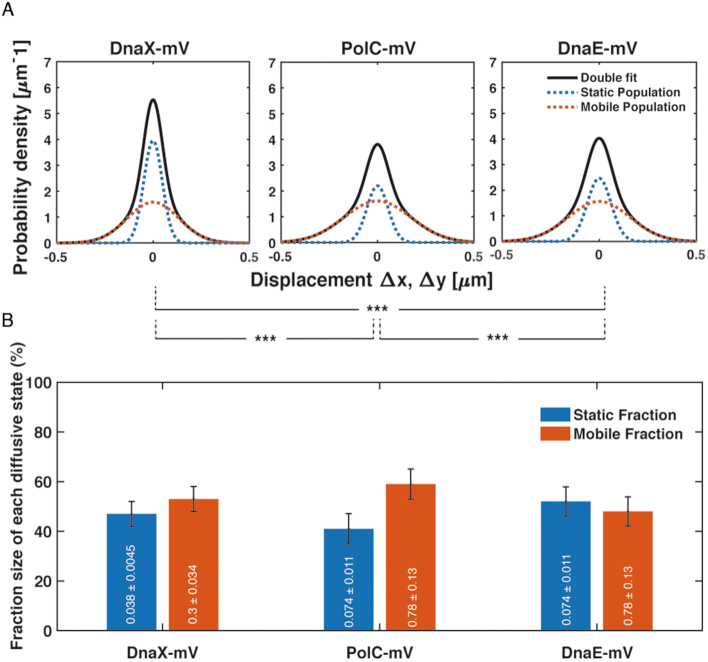
Figure 6.
Diffusion patterns of DnaX-mV compared to PolC-mV and DnaE-mV. (A) GMM analyses of frame-to-frame displacements in x- and y-directions of DnaX-mV, PolC-mV and DnaE-mV. Black lines represent the sum of the two Gaussian distributions. Dotted red and blue lines represent the single Gaussian distributions corresponding to the static and mobile fractions. (B) Bar plot with error bars shown illustrates fractions sizes in untreated cells and their error according to the 95% confidence intervals of the fit. Inside in white, each Diffusion coefficient in μm·s−2. As usual, *, ** and *** stands for p-values lower than 0.1, 0.05 and 0.01 respectively, whilst n.s. stands for statistically not significant according to a two-sample Kolmogorov–Smirnov significance test on the step size distributions. Note that the same diffusion constants for DnaE and PolC were chosen (these do not differ markedly from the actual diffusion constants), which slightly adapts the sizes of static and dynamic fractions, but allows for a direct comparison between the fraction sizes of the two proteins.

