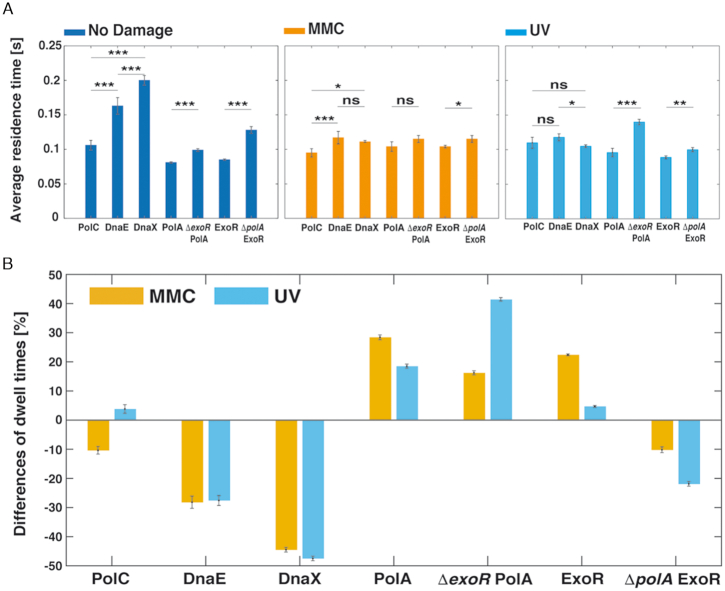
Figure 7.
Dwell times. (A) Relative differences of each strain once applied MMC and UV treatment respect to no treatment. (B) Average residence times (± standard error of the mean) of PolC-mV, DnaE-mV, PolA-mV, ExoR-mV, ExoR-mV ΔpolA and PolA-mV ΔexoR strains, before and after treatment with MMC or UV. Dwell times are estimated using an exponential decay model. Histograms show events of resting fitted by a two-component exponential function. *, ** and *** stand for P-values lower than 0.1, 0.05 and 0.01, respectively, whilst n.s. stands for statistically not significant changes on the dwell times distributions.

