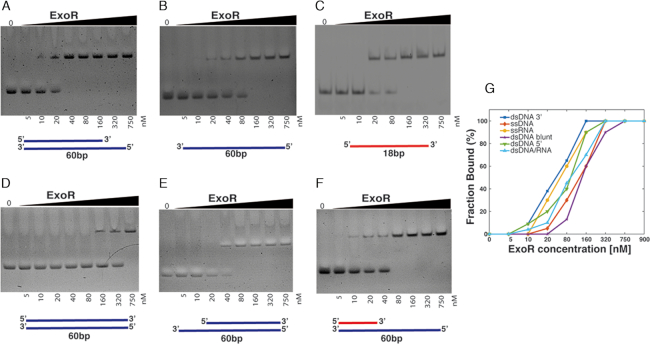
Figure 9.
DNA binding of ExoR. EMSAs showing ExoR binding to different nucleotide substrates. ExoR binding specifically to dsDNA panels A, D and E or ssDNA (panel B), or to RNA (panel C and F). EMSAs were performed with increasing amounts (0–750 nM) of purified ExoR and fragments of 68 bp, containing either DNA or RNA, generated by annealing of custom-made oligonucleotides. Samples were mixed with loading buffer and analysed through 6% (v/v) native polyacrylamide gels. Lanes labelled ‘0’ show the control substrate in the absence of protein. ExoR shows highest binding affinity to 5′ overhangs in dsDNA (panel A). Lines below each panel represent DNA in blue or RNA in red. (G) Plot of the measurement of the relative intensities of the two bands in the EMSA gels for each DNA/RNA substrate.

