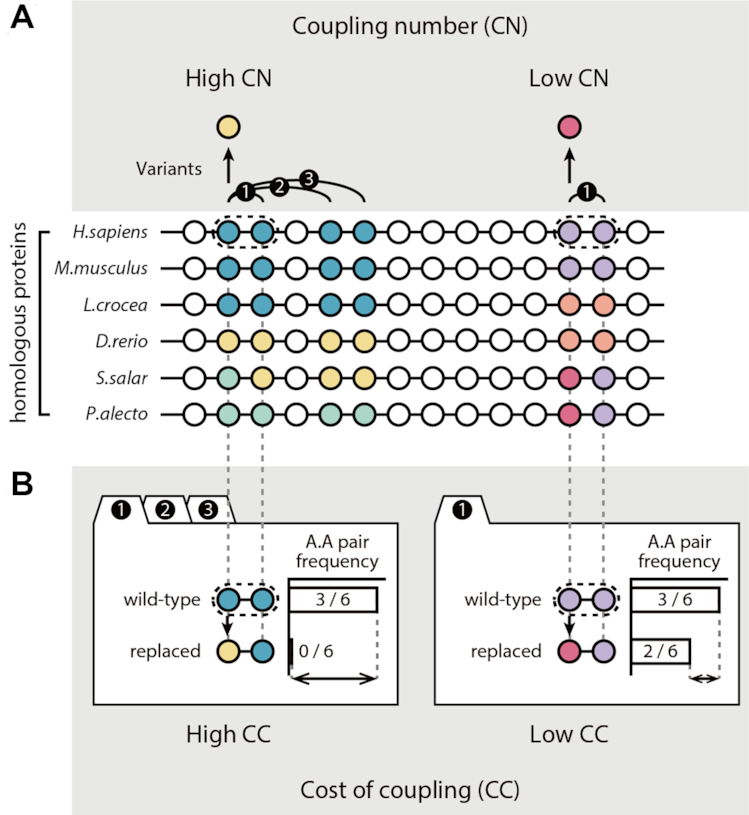
Figure 1.

Outline of variant impact prediction using coevolution (CE) scores. The CE scores for amino acid variants were calculated by multiplying two coevolutionary matrices: the CN and the CC. (A) Schematic diagram of the CN calculation. The colors of the circles indicate the types of amino acids. Curved lines represent evolutionary couplings between sites, and the numbers above the lines denote the order of the couplings at a site. Circles and straight lines represent the MSAs for the homologous proteins. (B) Schematic diagram of CC calculation. CC scores compared the frequency of amino acid pairs between wild-type and variant pairs at coupled sites from MSAs.
