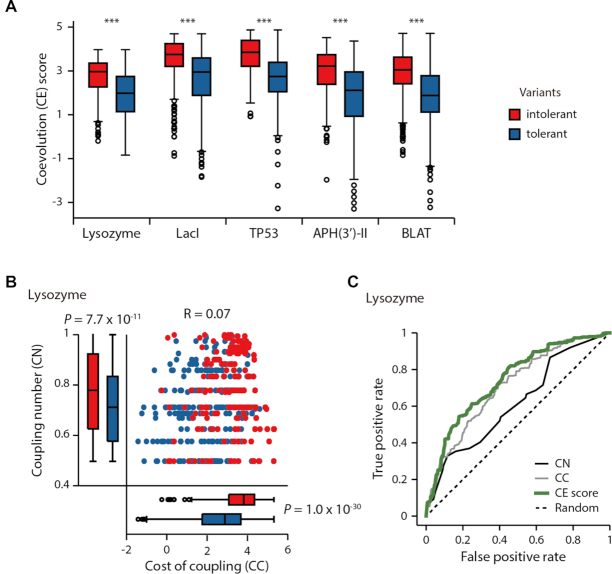
Figure 2.
Systematic and unbiased performance test for variant impact predictions using five saturated mutagenesis studies. (A) CE scores of intolerant (red) and tolerant (blue) variants. Asterisks denote significant differences for CE scores (Mann–Whitney U test, ***P < 1.0 × 10−39). (B) CN and CC distributions of intolerant and tolerant lysozyme variants. (C) The ROC curves of the CN, CC and CE scores for predicting the impacts of variants from the lysozyme mutagenesis study (AUCs for CE, CN and CC scores were 0.74, 0.62 and 0.71, respectively).

