
Figure 3.
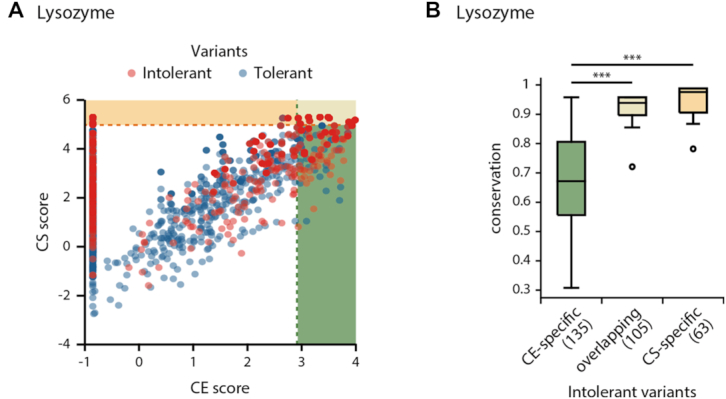
Prediction of the impacts of variants using CE and CS scores. (A) CE and CS scores of lysozyme intolerant (red) and tolerant variants (blue). The shaded regions represent where the CE (green) or CS (yellow) scores exceed the optimal thresholds. (B) Conservation of the CE-specific, overlapping or CS-specific intolerant variant sites.