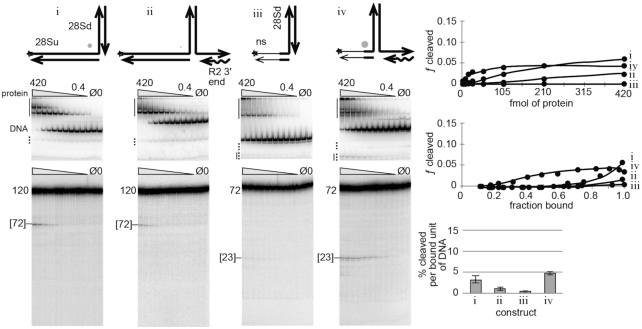
Figure 2.
First-strand DNA cleavage and TPRT products are not good substrates for second-strand DNA cleavage. Several bottom/first-strand nicked linear DNAs (i and iii) and TPRT analogs (ii and iv) were tested for cleavability by the R2Bm protein. The 120 bp nicked 28S DNA (i) is diagrammatically bent at a 90° angle with the downstream (dwn) oriented toward the top of the page (i.e. the North arm). The TPRT product (ii) is similarly drawn; the TPRT (i.e. the East arm) arm is 25 bp. The star indicates that the DNA strand was 5′ end-labeled to track DNA binding and cleavage. In constructs iii and iv, the thin lines represent non-specific sequences; the left West arm was 25 bp and only the 5 bp nearest the second-strand cleavage site remained 28S DNA. Below each of the construct cartoons are the native (EMSA) gels and corresponding denaturing gels used to analyze DNA binding (EMSA) and DNA cleavage (denaturing) of the given DNA construct by R2Bm protein. DNA binding and cleavage reactions were 13 µl and contained 80 fmol of radiolabeled construct DNA and 420–0.4 fmol of R2Bm protein (gray triangle). All EMSA gels were quantified such that the bands above the full construct DNA in the mock purified protein (Ø) and no protein (0) control lanes were subtracted out of the bound signal in the experimental lanes. Solid vertical lines next to the EMSA gels represent areas of the gel where the bound DNA signal resides. The well, the smear and the gel migrating complexes were all counted as bound DNA. DNA bands located below unbound (free) DNA that increased with protein concentration were counted as bound DNA since these bands were released cleavage products. The released cleavage product co-migrated with partial junctions (dotted line) present in the control lanes. The control lane partial junction signal was subtracted from the experimental lane's co-migrating bound signal. The remaining partial junctions (dotted line) were counted as unbound DNA in the experimental lanes. The main band in the mock purified (Ø; protein purified from an empty expression vector) and the no protein (0) lanes is the location of the unbound junction DNA (DNA). Next to the denaturing gels is the size of the uncleaved radiolabeled oligo. The size and migration of the band resulting from second-strand cleavage is indicated by brackets on the denaturing gel. The DNA binding and DNA cleavage results are plotted on three graphs: (i) fraction (ƒ) cleaved as a function of protein concentration (fmol/reaction); (ii) fraction cleaved as a function of fraction bound for reactions where roughly 20–95% of the DNA was bound; and (iii) a bar graph reporting the average percentage cleaved products per bound unit of DNA (fraction bound) for reactions in the linear part of the second graph. The diameter of the gray dot next to each construct cartoon reflects the relative cleavability of the construct normalized to construct v in the next figure. See Supplementary Figure S2 for a graph of fraction bound as a function of protein concentration and for endonuclease mutant R2 protein controls.

