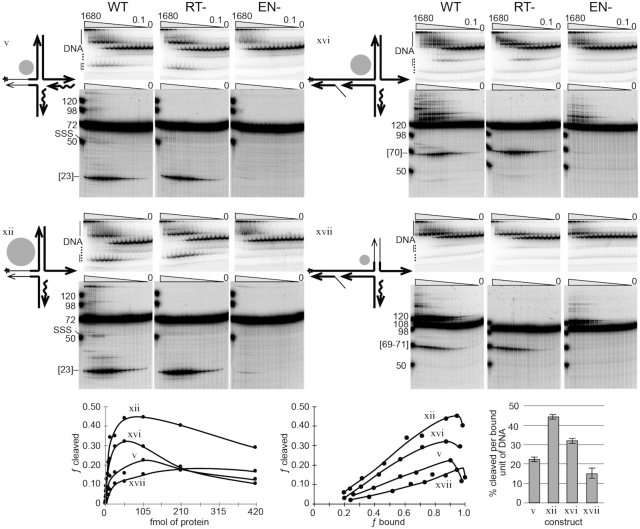
Figure 4.
Second-strand DNA cleavage followed by second-strand DNA synthesis. Symbols, conventions, reactions, gels, analysis and graphs are as previous figures, except that dNTPs were added to the reactions. The reactions were carried out using wild-type R2 protein (WT), reverse transcriptase mutant protein (RT-) and endonuclease mutant protein (EN-). In addition, a broader protein titration range was used, 1680–0.1 fmol. The graphs include only 420–0.4 fmol range of the RT- cleavage data. A new construct, xvii, was included in this dataset in addition to constructs v, xii, xvi. The amount of SSS was not quantified as the signal is too low for reliable numbers. See Supplementary Figure S4 for a graph of fraction bound as a function of protein concentration for RT-dataset.

