Figure 1.
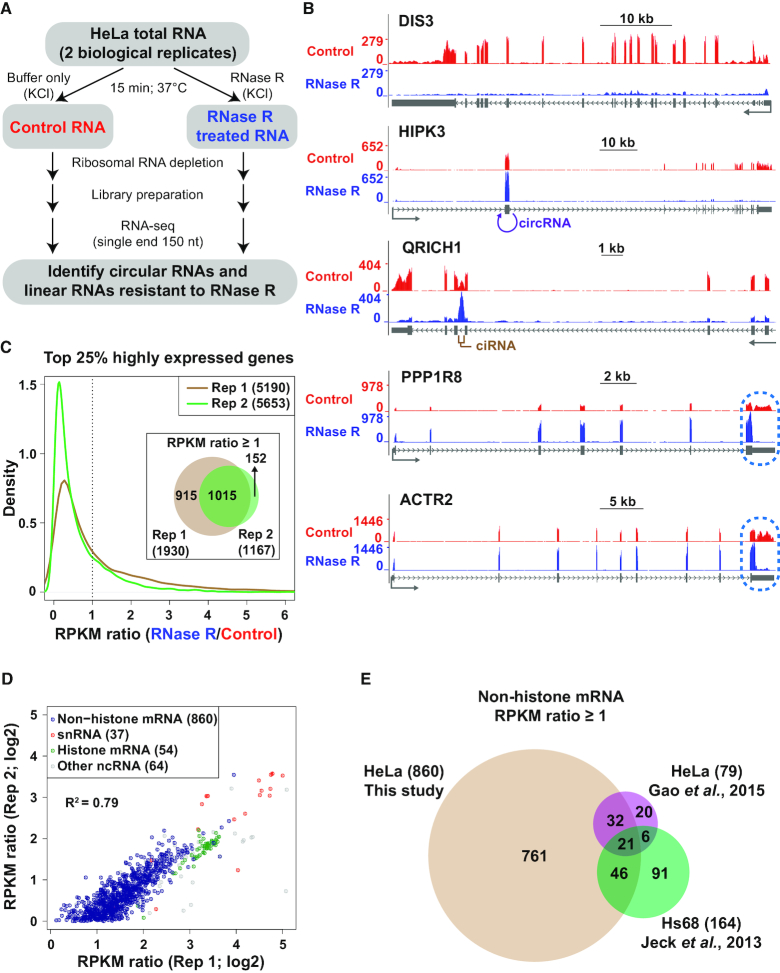
Hundreds of linear RNAs are resistant to RNase R digestion. (A) HeLa total RNA was incubated in KCl-containing buffer -/+ RNase R followed by preparation of RNA-seq libraries. (B) RNA-seq data generated from control (red) or RNase R treated samples (blue) were used to produce a normalized coverage value over individual nucleotides (Reads per Kilobase per Million [RPKM]). The DIS3, HIPK3, QRICH1, PPP1R8 and ACTR2 loci are shown. Gray arrows below gene models indicate the direction of transcription. Regions that generate an exonic circular RNA (circRNA) or a circular intronic RNA (ciRNA) are denoted in purple and brown, respectively. RNase R stalling in the terminal exons of PPP1R8 and ACTR2 is highlighted in blue. (C) For the top 25% of highly expressed genes in each RNA-seq replicate, the RPKM ratio (RNase R/Control) was calculated. A density plot showing the distribution of RPKM ratios is shown along with a Venn diagram denoting the number of genes with a RPKM ratio ≥1 in each replicate. (D) Comparison of RPKM ratios for the 1,015 genes that had a RPKM ratio ≥1 in both RNA-seq replicates. Genes encoding non-histone mRNAs (blue), snRNAs (red), histone mRNAs (green), and other noncoding RNAs (gray) are denoted. (E) The set of 860 non-histone genes with a RPKM ratio ≥1 in our data was compared to previously published RNA-seq experiments that analyzed RNA expression levels –/+ RNase R treatment. Non-histone mRNA genes with a RPKM ratio (RNase R/Control) ≥1 in each data set are shown.

