Figure 4.
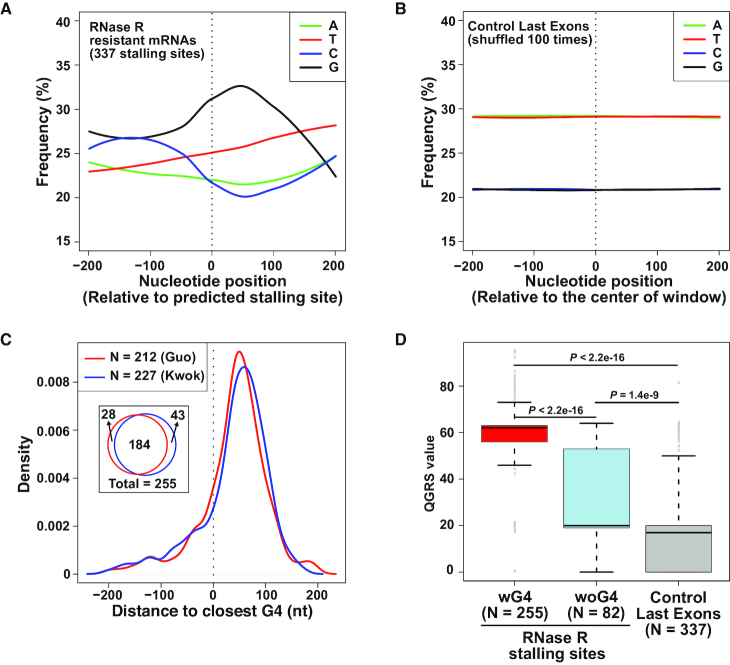
RNase R often stalls at G-rich regions that form G-quadruplexes. (A) Average nucleotide frequencies in the regions flanking the 337 RNase R stalling sites that were predicted by DaPars. Location of stalling site is denoted by dashed vertical line. (B) Stalling site locations were shuffled 100 times in the last exons of highly expressed (top 25%) genes and the average nucleotide frequencies were calculated as in A. (C) The locations of the 337 stalling sites predicted by DaPars were compared to annotated G-quadruplexes defined by Guo and Bartel (red) or Kwok et al. (blue). The density plot shows the distribution of distances from the predicted stalling sites to the nearest G-quadruplex in each dataset. The Venn diagram denotes the number of stalling sites with an annotated G-quadruplex within ±200 nt. (D) Quadruplex forming G-rich sequences (QGRS) values were calculated for the 400 nt regions flanking the 255 stalling sites with an experimentally annotated G4 nearby (red), the 82 stalling sites without an experimentally annotated G4 nearby (blue), and 337 shuffled stalling sites (gray). Box plots show the 25th–75th percentiles and whiskers represent extreme data points no more than 1.5 times the interquartile range. P values were calculated by Mann–Whitney U-test.

