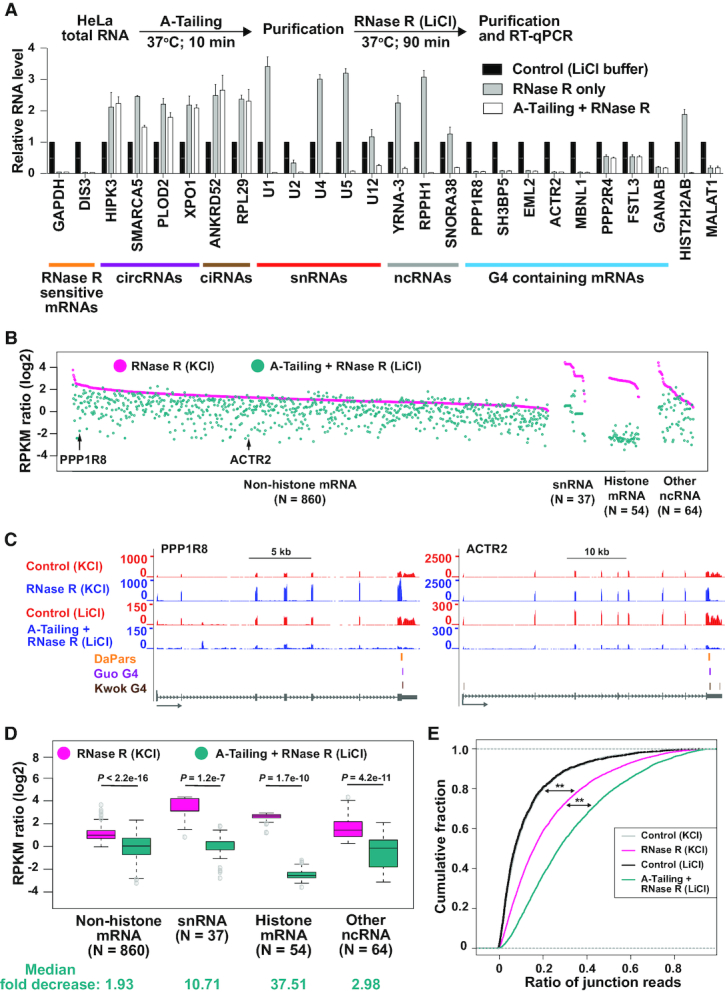
Figure 6.

A-Tailing followed by RNase R treatment in LiCl-containing buffer allows more efficient depletion of linear RNAs. (A) Purified HeLa total RNA was incubated with E-PAP prior to RNase R digestion in the presence of LiCl buffer (white bars). As controls, RNA was incubated only in the reaction buffers (black bars) or subjected to RNase R digestion alone (gray bars). 300 ng of the remaining RNA was used for reverse transcription followed by qPCR to measure the relative abundances of the indicated transcripts. RNase R sensitive mRNAs (orange), circRNAs (purple), ciRNAs (brown), snRNAs (red), ncRNAs (gray), and RNase R resistant mRNAs (blue) are noted. (B) For the 1015 genes that failed to be degraded by RNase R in the presence of KCl (RPKM ratio ≥ 1), the respective RPKM ratio (RNase R/Control) was determined after A-Tailing and RNase R treatment in the presence of LiCl (cyan). Data are grouped according to transcript class and then ranked by the RPKM ratio observed in the KCl dataset (pink). Each dot represents a specific gene, with PPP1R8 and ACTR2 marked by arrows. (C) RNA-seq tracks, highlighting the PPP1R8 and ACTR2 loci. Gray arrows below gene models indicate the direction of transcription. RNase R stalling sites predicted by DaPars (orange) and G-quadruplexes annotated by Guo and Bartel (purple) or Kwok et al. (brown) are shown. (D) Box plots depicting RPKM ratios (RNase R/Control) for non-histone mRNA, snRNA, histone mRNA, and other ncRNA gene loci when RNA was treated with RNase R in the presence of KCl (pink) or subjected to A-Tailing followed by RNase R treatment in the presence of LiCl (cyan). Box plots show the 25th–75th percentiles and whiskers represent extreme data points no more than 1.5 times the interquartile range. Mann–Whitney U-test was used to determine the statistical significance. Median fold decreases for each class were calculated and are denoted at the bottom. (E) Cumulative distribution functions of circRNA junction reads ratio (average number of circRNA junction reads predicted by CIRI2/total spliced reads) in RNA-seq datasets generated from the indicated treatment conditions. All genes that produced a circular RNA with at least 2 junction reads in one of the samples are included. Mann–Whitney U-test was used to determine the statistical significance. ∗∗P < 2.2e–16.
