Figure 1.
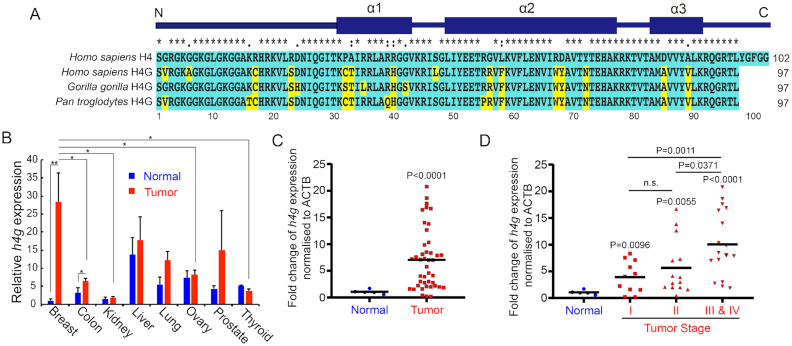
H4G expression in breast cancer patient tissues. (A) Amino acids sequence alignment between primate histone H4G and canonical H4 in primates. Unique amino acids to H4G in comparison with canonical human H4 are highlighted in yellow. (B) Relative H4G expression (mean ± SEM) obtained by quantitative real-time PCR in breast, colon, kidney, liver, lung, ovary, prostate and thyroid normal versus corresponding tumor tissues using the Cancer Survey qPCR panel (#CSRT101, Origene Technologies). *P < 0.05 and **P < 0.01 (Student's t-test). (C) The relative H4G expression obtained from quantitative real-time PCR in breast cancer patient breast tissues and normal breast tissues (#BCRT302, Origene Technologies). The black lines represent the mean expression level of h4g. (D) The relative H4G expression in breast cancer stages (#BCRT302, Origene Technologies). The black lines represent the mean expression level of h4g.

