Figure 6.
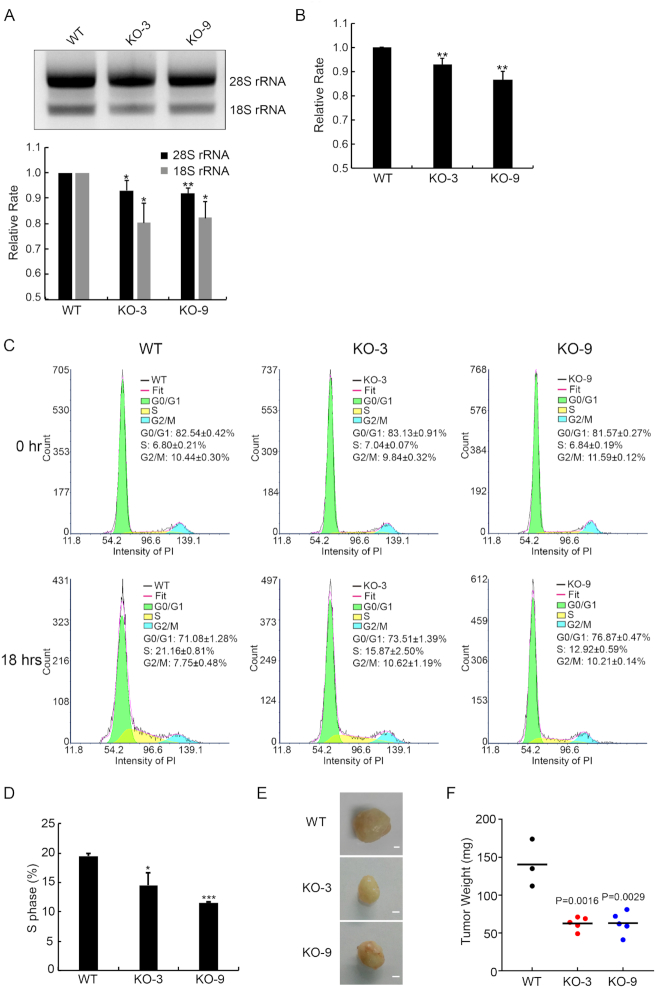
H4G is involved in rRNA transcription. (A) Comparison of rRNA amounts among WT and H4G knockout (H4GKO) MCF7 cell lines. Total RNA was normalized by GAPDH mRNA and loaded onto agarose gels. Error bars represent SD in triplicate experiments. *P < 0.05 and **P < 0.01 (Student's t-test). (B) The relative protein synthesis rate among WT and H4GKO MCF7 cell lines. Error bars represent SD. **P < 0.01. (C) Cell-cycle histograms acquired by flow cytometry and quantification of the subpopulation fraction of the histogram among WT and H4GKOs MCF7 cells. FACS plots and data are representative of at least three separate experiments. (D) The percentage of S phase cells among WT and H4GKOs MCF7 cells. Error bars represent SD. *P < 0.05, ***P < 0.001 (Student's t-test). (E) Representative photographs of the tumors from mouse xenograft model obtained with WT and H4GKO MCF7 cells. The scale bars represent 1 mm. (F) Tumor weight of the MCF7 cell and H4GKO MCF7 cells mouse xenograft models. The black lines represent the mean of tumor weight.

