
Figure 4.
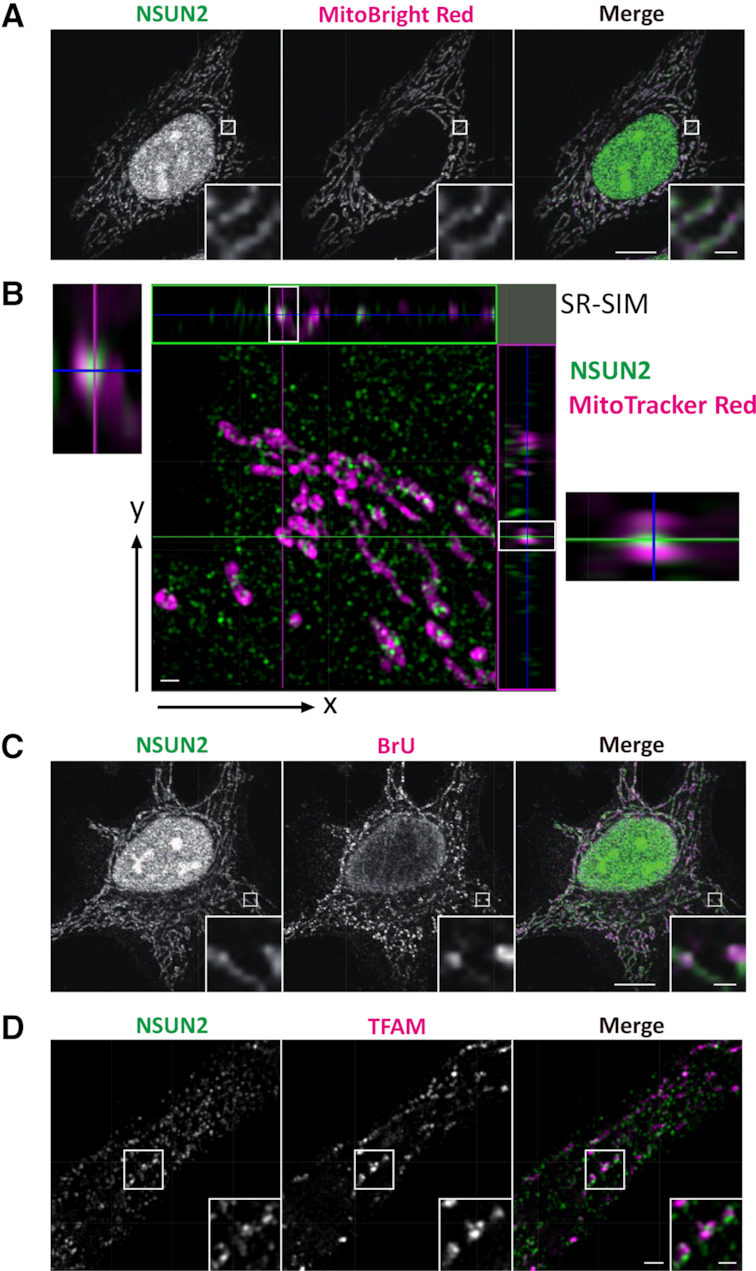
Subcellular localization of endogenous human NSUN2 (A and B) Subcellular localization of human NSUN2 in HeLa cells showing NSUN2 (green) and MitoBright Red (magenta) (A) or MitoTracker Red (magenta) (B). Fluorescence images were obtained by confocal microscopy (A) and super-resolution microscopy (SR-SIM) (B). Scale bars: 10 μm (A), 1 μm (inset of A) and 1 μm (B). (C) Fluorescence images of NSUN2 (green) and BrU (magenta) were obtained by confocal microscopy. Scale bars: main, 10 μm; inset, 1 μm. (D) Fluorescence images of NSUN2 (green) and TFAM (magenta) were obtained by SR-SIM. Scale bars: main, 1 μm; inset, 0.5 μm.