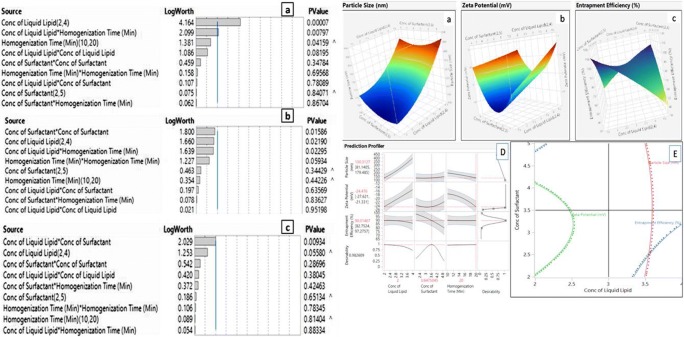
Fig. 3.
Pareto Chart and Response surface plots for the effect of CMA and CPP on a Particle Size in nm; b Zeta potential in mV; c Entrapment efficiency in %; d Prediction profiler plots representing maximum desirability of CMA and CPP; e Contour plot representing synergistic and antagonistic effect of CMAs and CPPs on CQA

