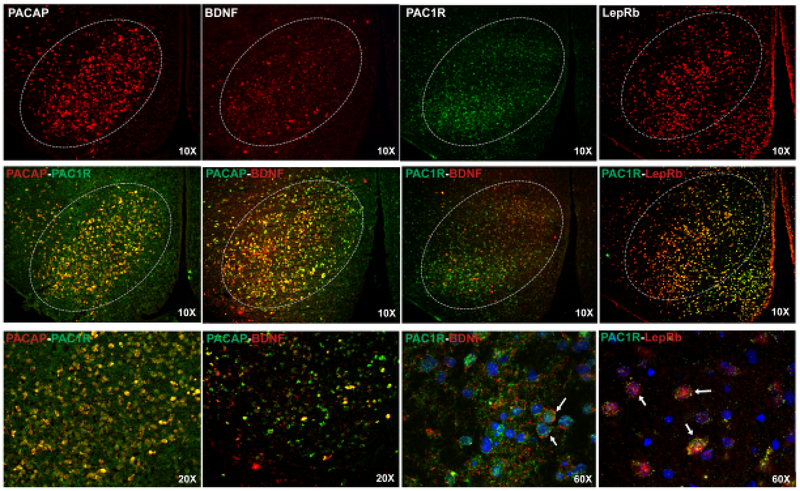
Figure 2.
Fluorescent photomicrographs of mRNA expression in the VMN (Bregma = 2.5–2.7mm) for PACAP, BDNF, PAC1R, and LepRb (top row) at 10X magnification. Second row: 10X images illustrate co-expression of PACAP/PAC1R, PACAP/BDNF, PAC1R/BDNF, and PAC1R/LepRb in cells of the VMN. Label colors correlate with similarly colored fluorophores. Third row: Higher magnification images of PACAP/PAC1R, PACAP/BDNF (20X) and PAC1R/BDNF, PAC1R/LepRb (60x). The 60X images show co-expression PAC1R, BDNF, and LepRb in DAPI delineated cells. Arrows identify examples of DAPI-labeled cells showing co-expression. 3V=third ventricle

