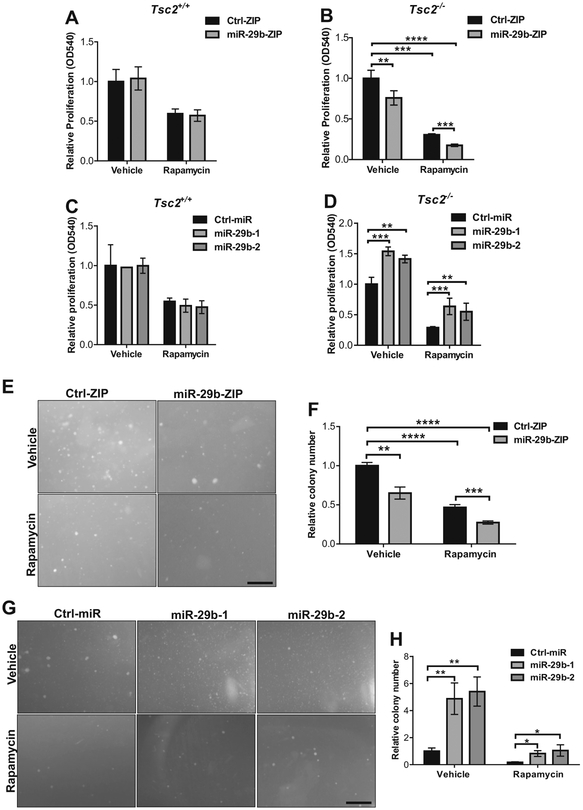
Fig. 2.
miR-29b regulates cell growth in Tsc2-deficient, but not Tsc2 wild-type cells. Cell proliferation was assessed by crystal violet staining in Tsc2+/+ (a) or Tsc2−/− (b) MEFs stably expressing miR-29b-ZIP or Ctrl-ZIP following treatment with rapamycin (20 nM) or vehicle (DMSO) for 72 h. Data are presented as mean fold change in OD 540 ± SD relative to Ctrl-ZIP cells treated with vehicle of n = 3 biological replicates. Cell proliferation was assessed by crystal violet staining in Tsc2+/+ (c) or Tsc2−/− (d) MEFs stably overexpressing pre-miR-29b-1 (miR-29b-1), pre-miR-29b-2 (miR-29b-2) or Ctrl-miR following treatment with rapamycin (20 nM) or vehicle (DMSO) for 72 h. Data are presented as mean fold change in OD 540 ± SD relative to Ctrl-miR cells treated with vehicle of three independent experiments. e Representative images of Tsc2−/− MEFs stably expressing Ctrl-ZIP or miR-29b-ZIP grown in soft agar with addition of vehicle (DMSO) or rapamycin (5 nM) for 2 weeks. f Data are presented as mean fold change in colony number ± SD relative to Ctrl-ZIP treated with vehicle of n = 3 biological replicates. g Representative images of Tsc2−/− MEFs stably overexpressing pre-miR-29b-1 (miR-29b-1), pre-miR-29b-2 (miR-29b-2), or Ctrl-miR grown in soft agar with addition of vehicle (DMSO) or rapamycin (5 nM) for 2 weeks. h Data are presented as mean fold change in colony number ± SD relative to Ctrl-miR treated with vehicle of n = 3 biological replicates. Data for bar graphs were calculated using two-way ANOVA followed by Bonferroni’s posttest for multiple comparisons. Scale bar = 500 μm. *P < 0.05; **P < 0.01; ***P < 0.001

