Fig. 3.
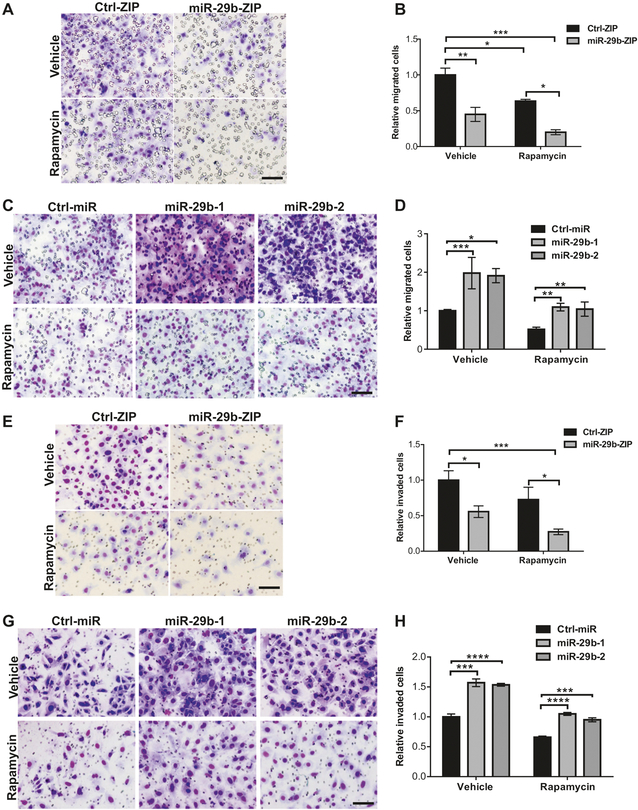
miR-29b regulates cell migration and invasion in Tsc2-deficient cells. a Representative images of the transwell assay with decreased migration towards 10% FBS-containing growth medium of Tsc2−/− MEFs with miR-29b inhibition (miR-29b-ZIP) treated with vehicle (DMSO) or rapamycin (20 nM) for 6 h. b Mean fold change of the number of migrated cells ± SD relative to vehicle-treated Ctrl-ZIP of n = 3 biological replicates. c Representative images of the transwell assay with increased migration towards 10% FBS-containing growth medium of Tsc2−/− MEFs stably overexpressing miR-29b-1 or miR-29b-2. d Mean fold change of number of migrated cells ± SD relative to vehicle-treated Ctrl-miR of n = 3 biological replicates. e Representative images of the Boyden chamber invasion assay, showing decreased invasive capacity of Tsc2−/− MEFs with miR-29b inhibition (miR-29b-ZIP) treated with vehicle (DMSO) or rapamycin (20 nM) for 24 h. f Mean fold change of number of invaded cells ± SD relative to vehicle-treated Ctrl-ZIP of n = 3 biological replicates. g Representative images of the Boyden chamber invasion assay, showing increased invasive capacity of Tsc2−/− MEFs stably overexpressing miR-29b-1 or miR-29b-2. h Mean fold change of number of invaded cells ± SD relative to vehicle-treated Ctrl-miR of n = 3 biological replicates. Data for bar graphs were calculated using two-way ANOVA followed by Bonferroni’s posttest for multiple comparisons. Scale bar = 85 μm. *P < 0.05; **P < 0.01; ***P < 0.001; ****P < 0.0001

