Fig. 4.
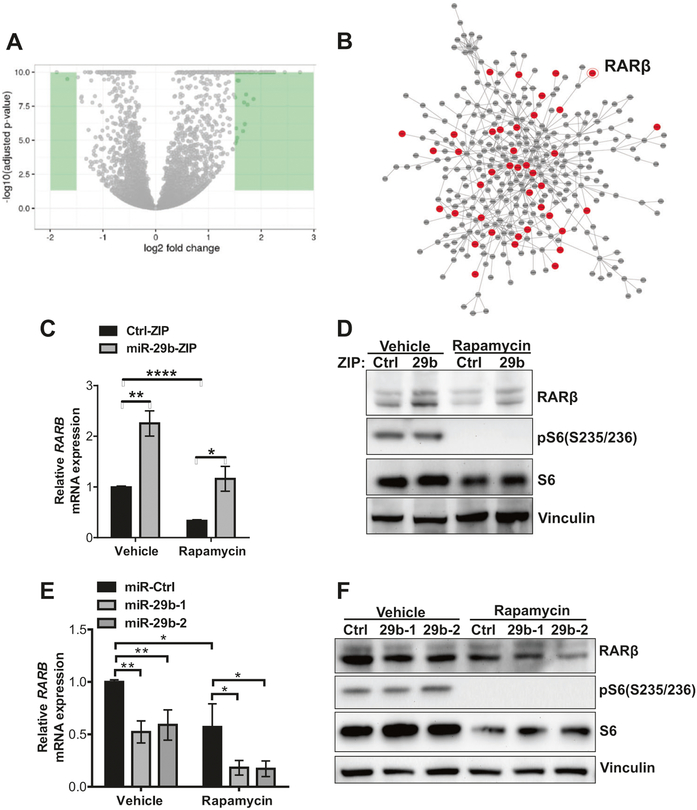
RNA sequencing identifies RARβ is a candidate target of miR-29b. a Volcano plot comparing changes in gene expression (as log2 fold change of fragments per kilobase of transcript per million mapped reads) of Tsc2−/− MEFs stably expressing miR-29-ZIP versus Ctrl-ZIP treated with rapamycin (20 nM) for 24 h. Green color highlights genes that were differentially regulated by log2 fold change > 1.5. b Interactome analysis of transcripts that are differentially regulated by miR-29b knockdown. Red indicates predicted direct targets and gray indicates indirect targets of miR-29b. c–f RARβ mRNA and protein levels were assessed in Tsc2−/− MEFs stably expressing miR-29b-ZIP or Ctrl-ZIP (c, d), or overexpressing miR-29b-1, miR-29b-2, or miR-Ctrl (e–f) treated with vehicle (DMSO) or rapamycin (20 nM) for 24 h. Data are presented as mean fold change ± SD relative to vehicle-treated controls of n = 3 biological replicates. Data for bar graphs were calculated using two-way ANOVA followed by Bonferroni’s posttest for multiple comparisons. *P <0.05; **P < 0.01; ****P <0.0001

