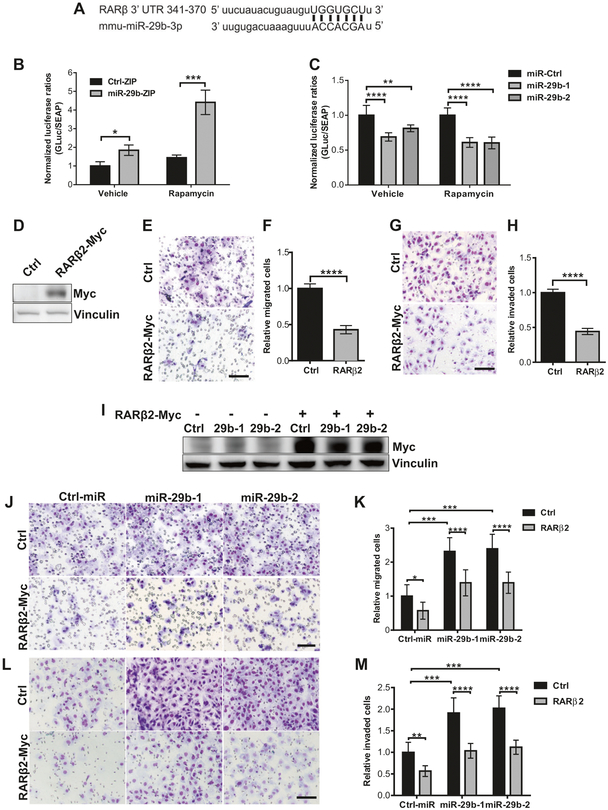
Fig. 5.
RARβ is a direct and functionally important target of miR-29b. a Sequence of mouse RARβ 3′UTR (nucleotide 341–370) showing the putative miR-29b-3p-binding site. Matching regions are indicated by lines. Dual-luciferase assay of Tsc2−/− MEFs stably expressing miR-29b-ZIP or Ctrl-ZIP (b), or overexpressing miR-29b-1, miR-29b-2 or miR-Ctrl (c) transfected with secreted Gaussia luciferase constructs containing the 3′UTR of RARβ for 24 h. Cells were then treated with vehicle (DMSO) or rapamycin (20 nM) for another 24 h. Secreted Gaussia luciferase activity was normalized to secreted alkaline phosphatase activity. Data are presented as relative luciferase activity ± SD relative to Ctrl-ZIP or Ctrl-miR treated with vehicle or rapamycin of n = 3 biological replicates. Data for bar graphs were calculated using one-way ANOVA followed by Bonferroni’s posttest for multiple comparisons. d Western blot analysis of Tsc2−/− MEFs transiently transfected with control vector or RARβ2-Myc-DDK. Vinculin was used as a loading control. e Representative images of migrated Tsc2−/− MEFs transiently transfected with control vector or RARβ2-Myc-DDK towards 10% FBS-containing growth medium. f Mean fold change of number of migrated cells ± SD relative to vector controls of n = 3 biological replicates and statistical significance was determined by two-tailed student’s t-test. g Representative images Boyden chamber invasion assays of Tsc2−/− MEFs transiently overexpressing RARβ2-Myc-DDK showing decreased cell invasion. h Mean fold change of number of invaded cells ± SD relative to vector controls of n = 3 biological replicates and statistical significance was determined by two-tailed student’s t-test. i Western blot analysis showing successful restoration of RARβ2 in Tsc2−/− MEFs overexpressing miR-29b-1 or miR-29b-2 transfected with RARβ2-Myc-DDK. Vinculin was used as a loading control. j Representative images of the transwell migration assay of Tsc2−/− MEFs overexpressing miR-29b-1 or miR-29b-2 with and without restoration of RARβ2. k Mean fold change of number of migrated cells ± SD relative to vector controls/control siRNA of n = 3 biological replicates. l Representative images of Boyden chamber invasion assays demonstrating RARβ restoration decreased the invasion of Tsc2−/− MEFs overexpressing miR-29b-1 or miR-29b-2. m Mean fold change of number of migrated cells ± SD relative to vector controls/control siRNA of n = 3 biological replicates. Scale bar = 85 μm. Data for bar graphs were calculated using two-way ANOVA followed by Bonferroni’s posttest for multiple comparisons. *P < 0.05; **P < 0.01; ***P < 0.001; ****P < 0.0001

