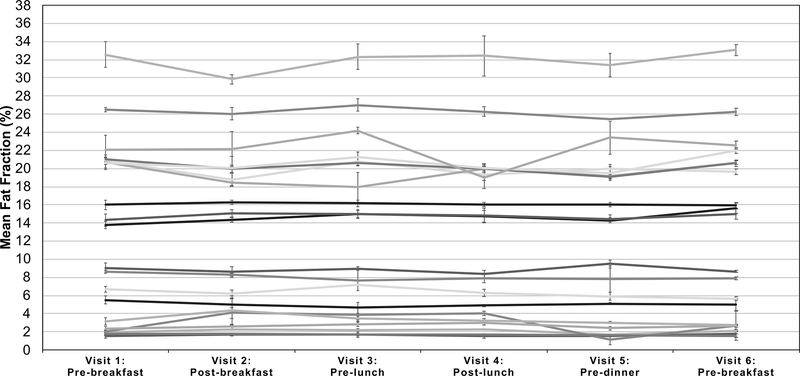
Figure 4:
Measured MRS-PDFF throughout the six visits that had no obvious diurnal trends. The average across all Couinaud segments and repeated scans is shown for each time point spanning the two days and 20 subjects. Error bars represent the standard deviation of the measured fat fraction across the three repeated measurements at each visit.

