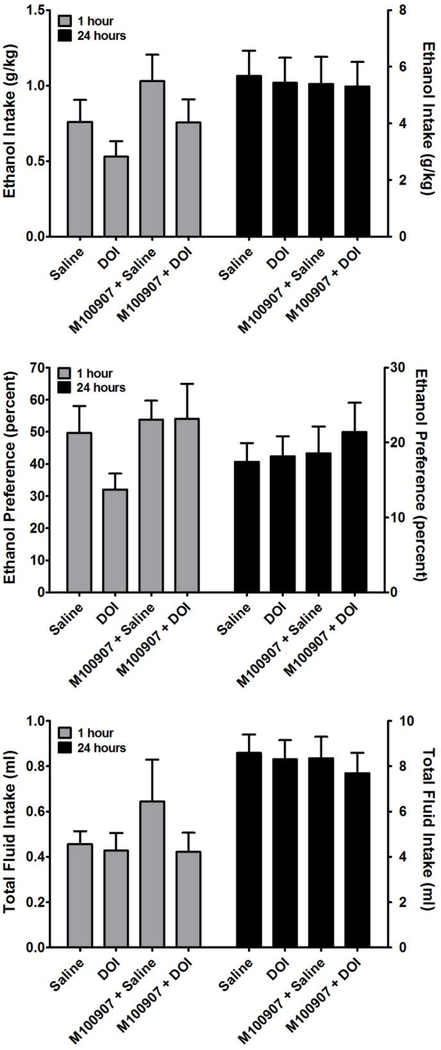
Figure 4.
Effects of DOI on ethanol intake (TOP), preference for ethanol consumption over water consumption (MIDDLE), and total fluid intake (BOTTOM). Data are subdivided to show the effects of ethanol 1 hour after treatment (Left Y-Axis) and 24 hours after treatment (Right Y-Axis). Data are presented from the bottom 50% of ethanol consuming mice. All values represent the mean ± SEM. There was no main effect of DOI treatment on any of these three parameters as assessed by repeated measures one-way analysis of variance.

