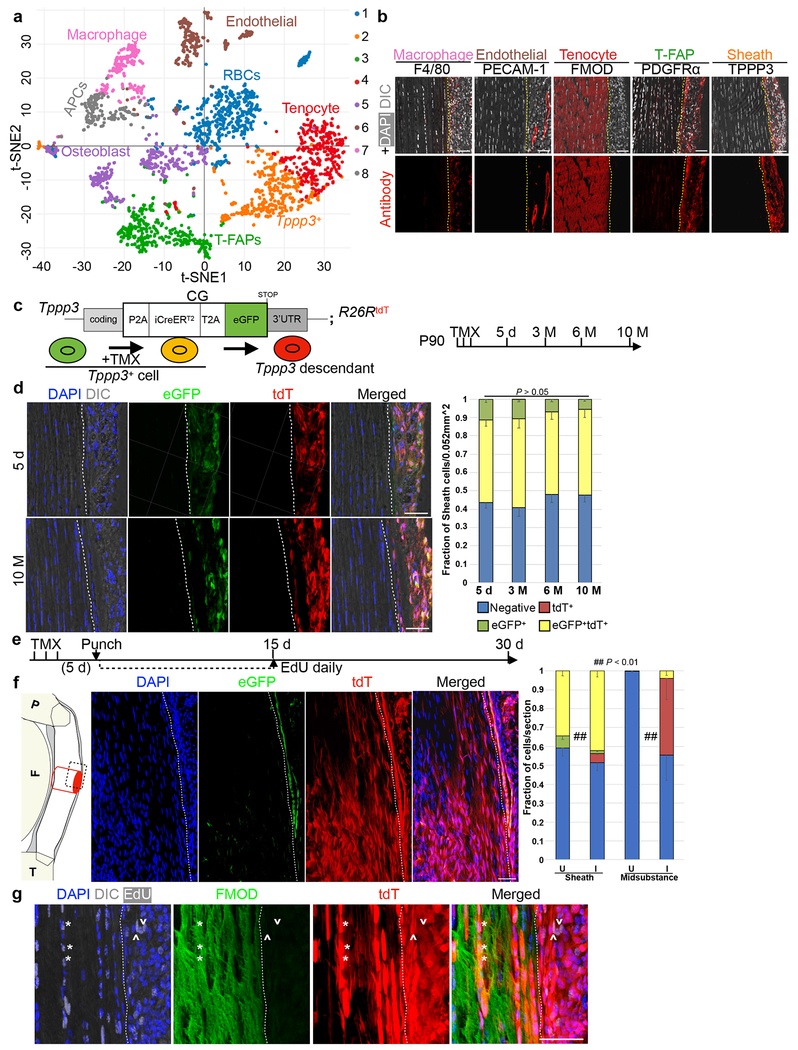
Fig. 1 |. Tendon harbors a self-renewing stem cell population.
a, tSNE plot for 2491 cells. Unsupervised clustering by Cell Ranger: keys to the clustering number to the right and cell type assignments on the plot. b, Immunofluorescence for indicated markers. Dashed lines indicate midsubstance-sheath boundary. c, Diagrams for Tppp3CG driver and experimental regimen: at P90, cells were marked by TMX for 3 d and chased to 5 d, and 3, 6, 10 M. d, Immunofluorescence images at 5 d and 10 M, and quantified cell fractions (keys at bottom); dashed line, midsubstance-sheath boundary; n=3 animals/condition; all ns by Chi-Square test; mean for (Negative, eGFP+, tdT+, and eGFP+tdT+) at specified time as follows: (5 d; 0.436, 0.113, 0, 0.451), (3 M; 0.410, 0.104, 0.0002, 0.104), (6 M; 0.479, 0.070, 0, 0.451), (10 M; 0.479, 0.057, 0, 0.465). e, Schema for tendon regeneration assay: same cell marking regimen as in (c), punch injury 5 d later and chased to 30 d; daily EdU for first 15 d. f, Diagram (left) of Patellar tendon at sagittal plane: P, patella; F, femur; T, tibia; midsubstance in white; sheath in gray; site of punch, red cylinder; imaged area, dashed box. Images in the middle and quantification to the right: U, uninjured; I, injured; examined cell groups same as (d); Chi-square test, ## p < 0.01; n=3 animals/condition; mean for (Negative, eGFP+, tdT+, and eGFP+tdT+) for specified condition as follows: (Sheath U; 0.608, 0, 0.051, 0.341), (Sheath I; 0.513, 0.015, 0.048, 0.424), (Midsubstance U; 1, 0, 0, 0), (Midsubstance I; 0.542, 0, 0.420, 0.038). g, High magnification of FMOD staining of 30 d regenerated tendons: *, proliferated Tppp3-descendant; ^, self-renewed Tppp3 lineage in sheath; 3 independent repeats; also see Extended Data 1k–m. Scale bars = 30 (a), 50 (d, f, g) μm.

