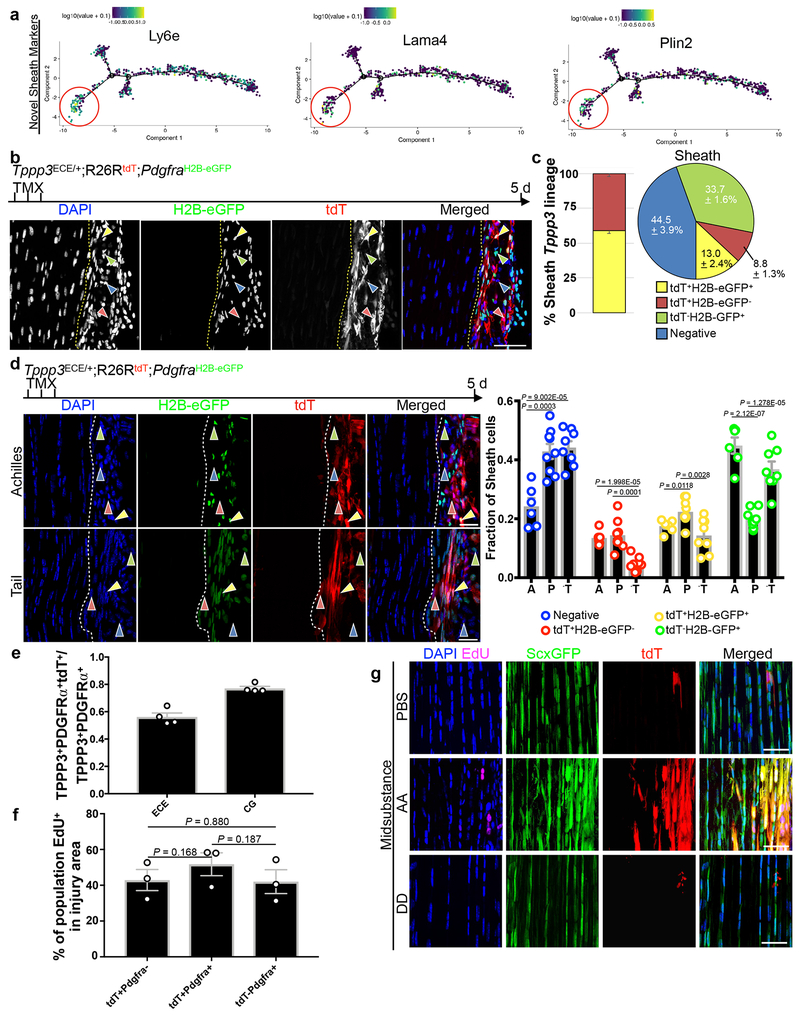
Extended Data 4. Tppp3+Pdgfra+ sub-population has tenogenic propensity.
a, Novel Sheath markers: Log10 gene expression level specified per individual cell plotted in pseudotime trajectory of cluster 2 and 4 cells. Red circles (enrichment in state 1), correlating with Tppp3 and Pdgfra (Fig. 3d), suggesting a unique role for state 1-Tppp3+Pdgfra+ cells (see Fig. 3d). b, Fluorescent images of Tppp3ECE/+;R26RtdT;PdgfraH2B-eGFP tendon 5 d after TMX-induced marking; n=3; dashed line, midsubstance-sheath boundary; yellow arrowheads, tdT+H2B-eGFP+ cells; red arrowheads, tdT+H2B-eGFP−; green arrowheads, tdT−H2B-eGFP+; blue arrowheads, negative; direct fluorescent imaging to visualize GFP signal from PdgfraH2B-eGFP. c, Relative cell fractions (keys; bottom) within Tppp3+(tdT+) population (bar graph) and within the sheath (pie chart) from data in (b); n=3 animals, N=3 samples/n; mean(%)=(tdT+H2B-eGFP+, 59.1; tdT+H2B-eGFP−, 40.9). d, (Left) Fluorescent images of Tppp3CG/+;R26RtdT;PdgfraH2B-eGFP Achilles or tail tendon 5 d after TMX-induced marking; n=3 animals; dashed line, midsubstance-sheath boundary; arrowheads same code as b; direct fluorescent imaging to visualize GFP signal from PdgfraH2B-eGFP. (Right) Bar graph of fraction of sheath cell populations across respective tendon types; A, Achilles; P, Patellar; T, tail; circles represent individual n; mean per specified population (Negative, tdT+H2B-eGFP−, tdT+H2B-eGFP+, tdT−H2B-eGFP+) in tendon type (A; 0.242, 0.134, 0.175, 0.448), (P; 0.428, 0.144, 0.229, 0.199), (T; 0.442, 0.047, 0.143, 0.368). e, Stem cell (Tppp3+PDGFRα+) recombination efficiency per Tppp3 driver; Tppp3CG efficiency is 77.0±1.6 (Mean±SEM)% and Tppp3ECE efficiency is 56.1±2.9 (Mean±SEM)%; determined in situ by tdT+ co-localization with anti-TPPP3 antibody+PDGFRaH2BeGFP+ cells; circles represent n; n=4 samples. f, Bar graph of proliferation indices from entrant populations corresponding to Fig. 4f, all comparisons non-significant; circles indicate n; n=3 animals, N=3 samples/n; mean (%) per population (tdT+Pdgfra−, 43.0 ; tdT+Pdgfra+, 51.8; tdT−Pdgfra+, 42.0). g, Fluorescent images of midsubstance with specified treatment on Tppp3ECE/+;R26RtdT;ScxGFP tendon; n=3 independent repeats. Error bars = SEM (c, d, e, f); scale bar = 30 (d, g), 50 (b) μm; two-tailed Student’s t-test (d, f).

