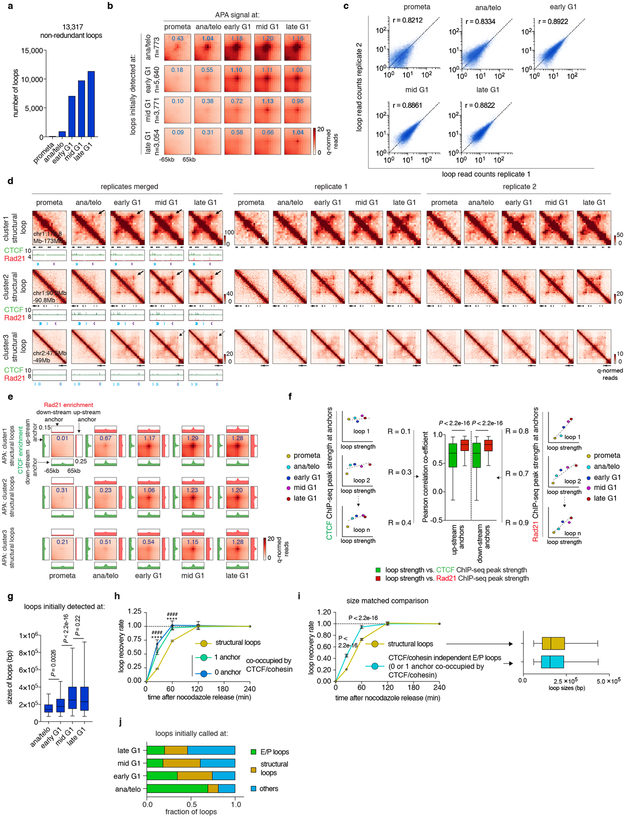
Extended Data Figure 6 ∣. Loop statistics and k-means clustering on structural loops.
a, Bar graph showing the number of loop calls at each cell cycle stage. b, Aggregated peak analysis (APA) of loops initially detected at each cell cycle stage. Bin size: 10kb. Numbers indicate average loop strength: ln(obs/exp). c. Scatter plots showing the Pearson correlation of loop strength (read counts) between two biological replicates. d, Hi-C contact maps showing representative regions that contain cluster 1 (chr1:172.8Mb-173Mb), 2 (chr1:90.2Mb-90.8Mb) and 3 (chr2:47.5Mb-49Mb) structural loops in merged and both biological replicates. Bin size: 10kb. Loop signal enrichment is indicated by black arrows. Contact maps are coupled with genome browser tracks showing CTCF and cohesin occupancy across all cell cycle stages. Chevron arrows mark orientations of CTCF sites at loop anchors. e, APA of cluster1, 2 and 3 structural loops across all cell cycle stages. Each heatmap is coupled with four meta-region plots corresponding to CTCF and Rad21 ChIP-seq signals centered around either up-stream or down-stream loop anchors. Bin size: 10kb. Numbers indicate average loop strength: ln(obs/exp). f, Left and Right: Schematics showing how correlations are computed between CTCF or Rad21 and loop strength over time. Middle: Box plot showing the Pearson correlation coefficients between CTCF or Rad21 ChIP-seq peak strength at up-stream or down-stream anchors and structural loop strength over time (n=4,712). For all box plots, center lines denote medians; box limits denote 25-75 percentile; whiskers denote 5-95 percentile. P values were calculated by two-sided Wilcoxon signed-rank test. g, Box plot showing sizes of structural loops initially detected ana/telo (n=90), early G1 (n=2,233), mid G1 (n=1,595) and late G1 (n=793). For all box plots, center lines denote medians; box limits denote 25-75 percentile; whiskers denote 5-95 percentile. P values were calculated by two-sided Mann-Whitney U test. h, Average recovery curves of structural loops (n=4,241) and E/P loops with 0 (n=678) or 1 (n=1,338) anchor co-occupied by CTCF/cohesin. 10% of the loops with smallest increment from prometa to late G1 were filtered out from analysis. Error bars denote mean ± 99% confidence interval. **** or #### p < 2.2e-16 (structural loops vs. E/P loops with 0 or 1 anchor co-occupied by CTCF/cohesin respectively). Two-sided Mann-Whitney U test. i, Left: Average recovery curves of randomly sampled and size matched structural loops and CTCF/cohesin independent E/P loops (n=2,869 for both groups). 10% loops with the lowest increment from prometa to late G1 were dropped from the analysis. Error bars denote mean ± 99% confidence interval. P values were calculated by two-sided Mann-Whitney U test. Right: Box plot showing the comparable size distribution of these two randomly sampled groups (n=2,869 for both). For both box plots, center lines denote medians; box limits denote 25-75 percentile; whiskers denote 5–95 percentile. j, Bar graphs depicting the composition of loops newly called at each cell cycle stage.

