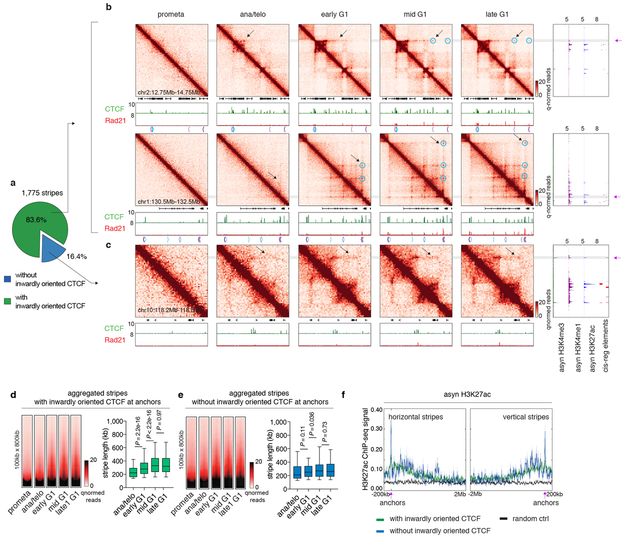
Extended Data Figure 7 ∣. Reformation of chromatin stripes after mitosis.
a, Pie chart showing the fraction of stripes with inwardly oriented CTCF at stripe anchors. b, Hi-C contact maps of two representative regions (chr2:12.75Mb-14.75Mb and chr1:130.5Mb-132.5Mb) that contain stripes with inwardly oriented CTCF. Bin size: 10kb. Contact maps are coupled with genome browser tracks of CTCF and Rad21 across all cell cycle stages and tracks of asynchronous H3K4me3, H3K4me1 and H3K27ac and annotation of cis-regulatory elements. Chevron arrows mark positions and orientations of CTCF peaks at stripe and loop anchors. Lengthening of stripes is indicated by black arrows. Stripe anchors are indicated by purple arrows. Loops along the stripe axis and at the far end of stripes are indicated by blue circles. c, similar to (b) Hi-C contact maps showing a representative stripe (chr10:118.2Mb-118.8Mb) that does not have inwardly oriented CTCF at stripe anchor. d, Left: Aggregated Hi-C contact maps that compiles all stripes with inwardly oriented CTCF to show their overall dynamic growing after mitosis. Right: Box plots showing the lengths of these stripes at ana/telo (n=235), early G1 (n=1,472), mid G1 (n=1,477) and late G1 (n=1473). For all box plots, center lines denote medians; box limits denote 25-75 percentile; whiskers denote 5-95 percentile. P values were calculated by two-sided Mann-Whitney U test. e, Similar to (d), showing stripes without inwardly oriented CTCF. n= 73, 282, 278, 273 for ana/telo, early G1, mid G1 and late G1, respectively. f, H3K27ac ChIP-seq profile from asynchronous G1E-ER4 cells is plotted −200kb to 2Mb around the horizontal stripe anchors and −2Mb to 200kb around the vertical stripe anchors. Anchor position is indicated by purple arrows.

