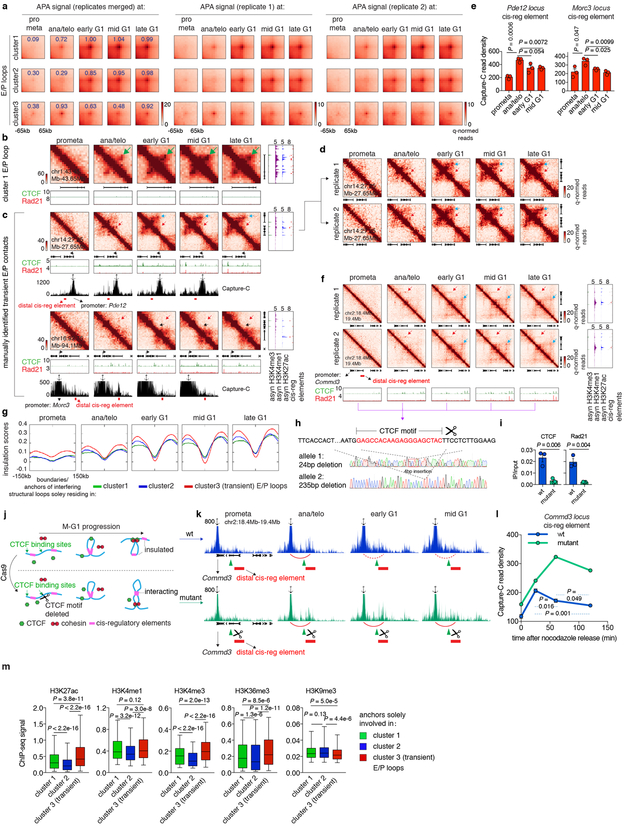
Extended Data Figure 8 ∣. Supplemental E/P loop analyses.
a, Aggregated peak analysis (APA) of the three clusters of E/P loops on merged and two biological replicates. Bin size: 10kb. Numbers indicate average loop strength: ln(obs/exp). b, Hi-C contact maps showing an additional example of cluster 1 E/P loop (chr1:43.45Mb-43.65Mb, green arrow). Bin size: 10kb. Color bar denotes q-normed reads. Contact maps are coupled with genome browser tracks of CTCF and cohesin across all time points as well as asynchronous H3K4me3, H3K4me1 and H3K27ac and annotations of cis-regulatory elements. c, Similar to (b), showing two examples of manually identified transient E/P contacts (Pde12 locus and Morc3 locus, indicated by red arrow). Boundaries or structural loop anchors that potentially interfere with these E/P contacts are indicated by black and blue arrows respectively. Contact maps are coupled with tracks of Capture-C interaction profiles. Probes (anchor symbol) are located at promoters of Pde12 and Morc3 genes respectively. d, Hi-C contact maps showing Pde12 locus on two biological replicates. Bin size: 10kb. e, Quantification of the Capture-C read density of the red regions in (c). n=3 biological replicates. Error bars denote mean ± SEM. P values were calculated from two-sided Student’s t test. f, Similar to (d), Hi-C contact maps showing the cluster3 E/P loop (red arrows) at Commd3 locus in two biological replicates. Potential interfering loop is indicated by blue arrows. g, Insulation score profiles centered around the boundaries and interfering structural loop anchors that solely reside within cluster 1, 2 or 3 E/P loops respectively. h, Sanger sequencing profiles showing the deletion of CTCF core motif at the up-stream anchor of the structural loop (blue arrows in f) that potentially interfere the cluster3 E/P loop at Commd3 locus (red arrows in f). i, ChIP-qPCR showing the abrogation of CTCF and Rad21 binding at the edited site in (f). n=3 biological replicates. Error bars denote mean ± SEM. P values were calculated by two-sided Student’s t test. j, Schematic showing potential behavior of cluster 3 E/P loops before and after deleting the interfering structural loop anchor. k, Capture-C interaction profiles between Commd3 promoter and down-stream cis-regulatory element (red bars) on WT and interfering anchor deleted mutant cells over time. Capture probe location was indicated by anchor symbol. Deleted CTCF site was indicated by green triangles. Formation of transient loop was indicated by red arches. l, Quantification showing read density of the red regions in (k). n=3 and 2 biological replicates for WT and mutant cells respectively. Error bars denote mean ± SEM. P values were calculated by two-sided Student’s t test. m, Box plots showing ChIP-seq signals of indicated histone modifications at anchors that solely participate in cluster 1, 2 or 3 (transient) E/P loops (n=2,612; 1,338 and 413 respectively). For all box plots, center lines denote medians; box limits denote 25-75 percentile; whiskers denote 5-95 percentile. P values were calculated by two-sided Mann-Whitney U test.

