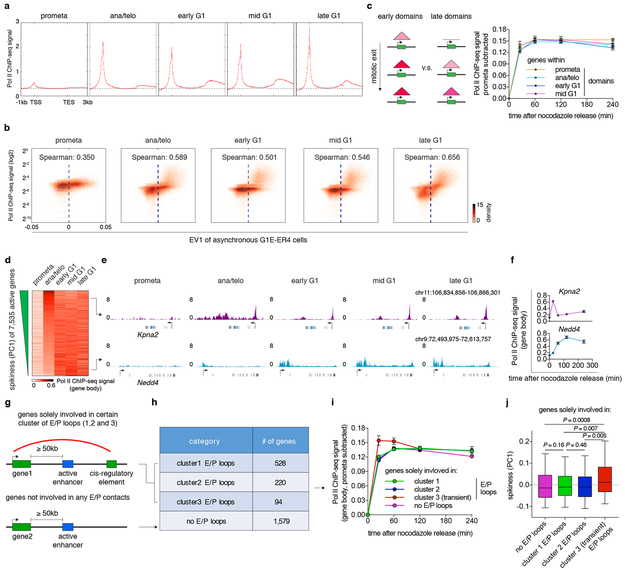
Extended Data Figure 9 ∣. Relationship between post-mitotic structural organization and gene reactivation.
a, Meta-region analysis of Pol II occupancy of active genes across all cell cycle stages. TSS: transcription start site. TES: transcription end site. b, Bin plots showing the positive correlation between Pol II ChIP-seq signal strength and eigenvector 1 (asynchronous G1E-ER4 cells 25, 25kb binned) genome wide. c, Left: Schematic showing genes that are within early or late domains. Right: Average Pol II occupancy of genes that reside in prometa (n=2,274 genes) ana/telo (n=2,114 genes), early G1 (n=1,159 genes) and mid G1 (n=303 genes) emerging domains. Error bars denote mean ± 99% confidence interval. d, Heatmap showing gene body Pol II occupancy across all cell cycle stages. Genes are ranked by their PC1 values (“spikiness”). e, Genome browser tracks showing representative examples of early spiking (Kpna2) and gradually activating (Nedd4) genes. f, Quantification of gene body Pol II occupancy in (e). n=2 biological replicates for 0h, and n=3 biological replicates for other time points. Error bars denote mean ± SEM. g, Schematic showing the stratification of genes based on their involvement of E/P loops. h, Table showing number of genes that solely involve in certain cluster of E/P loops. i, Average gene body Pol II occupancy of genes in (h) over time. Sample sizes are shown in (h). Error bars denote mean ± SEM. j, Box plots showing the spikiness (PC1) of genes in (h). Sample sizes are shown in (h). For all box plots, center lines denote medians; box limits denote 25–75 percentile; whiskers denote 5–95 percentile. P values were calculated by two-sided Mann-Whitney U test.

