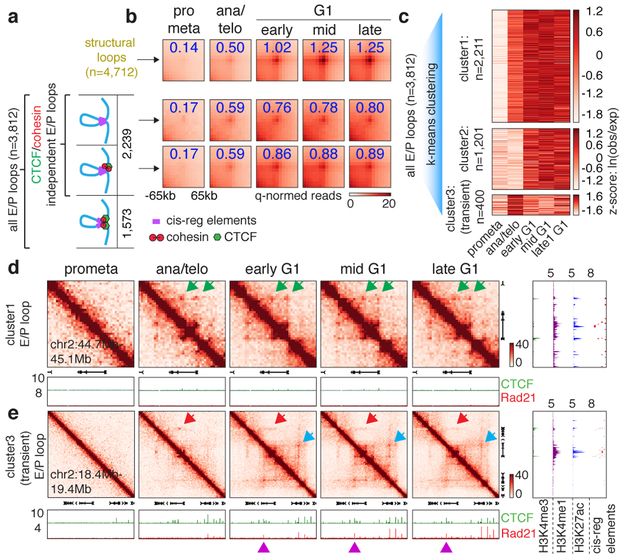
Figure 4 ∣. cis-regulatory contacts are established rapidly after mitosis and can be transient.
a, Schematic depicting classification of loops. E/P loops were sub-divided into those with 0, 1, or 2 anchors harboring CTCF/cohesin co-occupied sites. Those with 0 or 1 anchor co-occupied by CTCF/cohesin were classified as E/P loops independent from CTCF/cohesin. b, Aggregated peak analysis (APA) of CTCF/cohesin independent E/P loops (middle and bottom panels) in comparison to structural loops (top panel). Bin size: 10kb. Numbers indicate average loop strength: ln(obs/exp). c, Heatmap of k-means clustered E/P loops. d, Hi-C contact maps of a representative region (chr2:44.7Mb-45.1Mb) containing cluster 1 E/P loops (green arrows), coupled with browser tracks of CTCF and Rad21 occupancy. Bin size: 10kb. Color bar denotes q-normed reads. Tracks of H3K4me3, H3K4me1, H3K27ac, and annotations of cis-regulatory elements were from asynchronously growing G1E-ER4 cells. e, Similar to (d), representative region (Commd3 locus, chr2:18.4Mb-19.4Mb) containing a cluster 3 (transient) E/P loop (red arrows). Blue arrows denote the formation of a down-stream, potentially interfering structural loop. Purple arrowheads indicate CTCF/cohesin binding at the potential interfering structural loop anchor.

