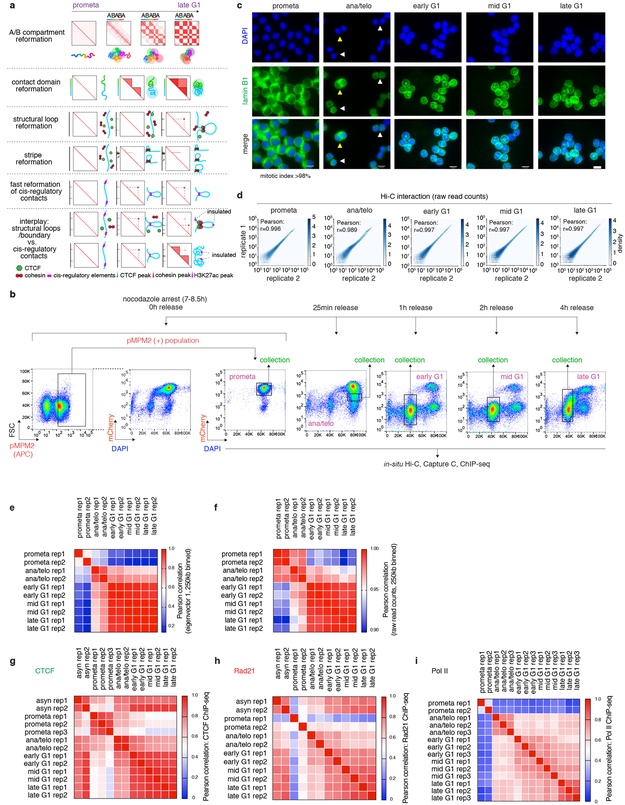
Extended Data Figure 1 ∣. Models, experimental workflow and data quality control.
a, 1st panel: Schematic illustration of the early emergence, gradual intensification and expansion of A/B compartments (checkerboards) from prometaphase to late G1 phase, coupled with schematics of chromatin organization. 2nd panel: SubTADs (small triangles) emerge first after mitotic exit, followed by convergence into a TAD (big triangle). 3rd panel: Formation of a structural loop coincides with the positioning of cohesin, but not CTCF after mitosis. 4th panel: The gradual extrusion of cohesin complex along DNA fiber from one anchor point with CTCF, reflected as enrichment of interactions between the anchor and a continuum of DNA loci on the contact map. 5th panel: Fast formation of E/P loops after mitosis. 6th panel: The interplay between transient E/P loops and boundaries or structural loops. b, Experimental workflow: representative flow cytometry plots showing the nocodazole arrest/release strategy based on pMPM2 (prometaphase), mCherry-MD signal, and DNA content (DAPI) staining. Similar observations were made in > 5 independent experiments. c, Representative images showing DAPI and lamin B1 staining of FACS purified cells across all cell cycle stages. Similar observations were made in 2 independent experiments. The mitotic index of prometaphase cells after FACS purification is on average > 98%. Yellow and white arrowheads indicate anaphase and telophase cells respectively. Scale bar: 10μm. d, Hexbin plots showing the high correlation of Hi-C raw read counts between two biological replicates across all cell cycle stages. Bin size: 250kb. e, Heatmap showing the Pearson correlation among all Hi-C samples, based on the eigenvector 1 of 250kb bins. f, Heatmap showing the Pearson correlation among all Hi-C samples based on raw read counts. Bin size: 250kb. (g-i), Heatmaps showing Pearson correlation of CTCF, Rad21 and Pol II ChIP-seq among all samples, respectively. Note the overall high replicate concordance with low correlation coefficients among replicates only observed in samples with low signal/noise ratios, e.g. in prometaphase.

