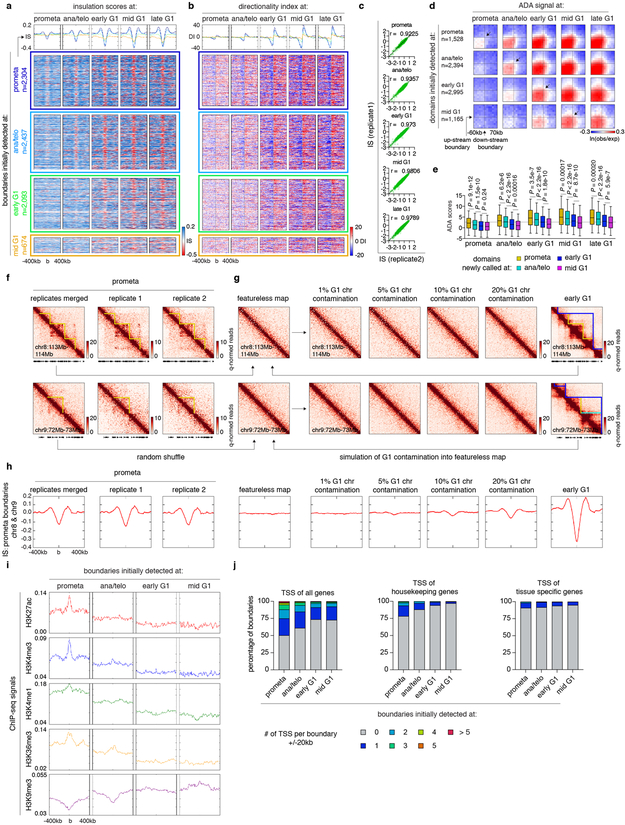
Extended Data Figure 3 ∣. Domain detection and residual “domain-like” structures in prometaphase.
(a-b), Meta-region plots and density heatmaps of insulation scores and directionality index centered around domain boundaries initially detected at each cell cycle stage. c, Scatter plots showing Pearson correlations of insulation scores at domain boundaries between two biological replicates. d, Aggregated domain analysis (ADA) of domains initially detected at each cell cycle stage. e, Box plots showing ADA scores over time of domains initially detected at prometa (n=1,360), ana/telo (n=2,260), early G1 (n=2,875) and mid G1 (n=1,112). For all box plots, center lines denote medians; box limits denote 25-75 percentile; whiskers denote 5-95 percentile. P values were calculated from two-sided Mann-Whitney U test. Dotted line indicates the average ADA score of initial domain detection. f, Hi-C contact maps of two representative regions (chr8:113Mb-114Mb & chr9:72Mb-73Mb) showing residual domain/boundary-like structures (yellow lines) in prometaphase in merged and individual biological replicates. Bin size: 10kb. g, Simulated featureless, percent “G1 contaminated”, and early G1 contact maps of the same regions as (f). Bin size: 10kb. h, Meta-region plots showing the insulation scores of prometaphase, simulated featureless, “G1 contaminated” and early G1 samples, centered around prometaphase boundaries in chr8 and chr9. i, Meta-region plots showing indicated histone modification profiles centered around boundaries newly detected at each cell cycle stage. j, Bar graphs showing the enrichment of TSS (overall, housekeeping and tissue-specific 9) within ± 20kb of boundaries newly detected at each cell cycle stage.

