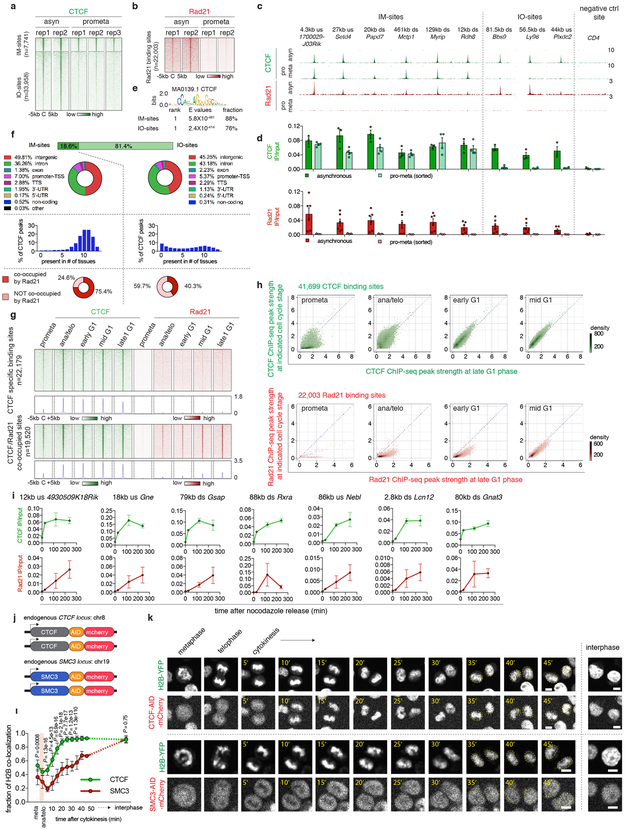
Extended Data Figure 5 ∣. CTCF and cohesin chromatin occupancy in mitosis and G1 entry.
a, A density heatmap of CTCF ChIP-seq of each biological replicate of asynchronous and prometaphase samples, centered around IM- and IO-CTCF binding sites. b, A density heatmap of Rad21 ChIP-seq of both biological replicates of asynchronous and prometaphase samples centered around all Rad21 peaks. c, Genome browser tracks showing CTCF and Rad21 ChIP-seq signals of asynchronous and prometaphase samples at indicated regions. n=2-3 biological replicates. d, ChIP-qPCR of CTCF and Rad21 in asynchronous (n=3, 6 biological replicates for CTCF and Rad21 respectively) and prometaphase samples (n=4, 3 biological replicates for CTCF and Rad21 respectively). Error bars denote mean ± SEM. e, Motif enrichment analysis of IM- and IO-CTCF binding sites with indicated E values. f, Upper panel: donut charts showing the genome wide distribution of IM- and IO-CTCF binding sites. Middle panel: Bar graphs showing the percentage of IM- or IO-CTCF binding sites that are found in indicated numbers of tissues. Bottom panel: donut pie chart showing the fraction of IM- and IO-CTCF binding sites that are co-occupied by Rad21. g, Density heatmaps and meta-region plots of CTCF and Rad21 ChIP-seq across all time points centered around CTCF specific and CTCF/Rad21 co-occupied binding sites. h, Bin plots showing ChIP-seq signals of CTCF and Rad21 peaks for each cell cycle stage (y-axes) against late G1 (x-axis). i, ChIP-qPCR of CTCF and Rad21 at indicated binding sites across time points. n=2 biological replicates for 0 and 25min, and n=3 biological replicates for 120 and 240min after nocodazole release. Error bars denote mean ± SEM. j, Schematic showing mCherry tagging of endogenous CTCF and SMC3. k, Representative images (from ≥ 10 dividing cells) illustrating behaviors of mCherry tagged CTCF and SMC3 during mitosis-early G1 phase progression. Similar observations were made in 2 independent experiments. Yellow dotted circles demarcate cell nuclei after mitosis. Scale bar: 5μm. l, Average recovery curve of mCherry tagged CTCF and SMC3 that co-localize with H2B-YFP. 11 mother cells/22 daughter cells and 10 mother cells/18 daughter cells were analyzed for CTCF and SMC3, respectively. P values were calculated using two sided Student’s t test. Error bars denote mean ± SEM. P values were omitted at time points with fewer than 5 cells.

