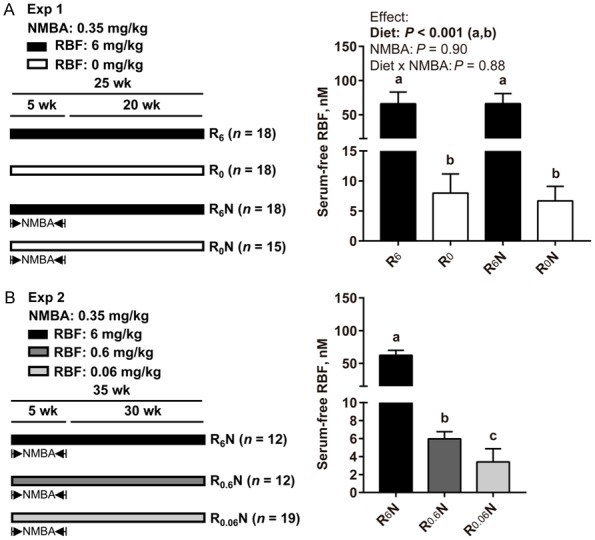
Figure 1.

Establishment of a rat model induced by RBF deficiency combined with NMBA. (A, left) Exp 1. Sixty-nine male F344 rats were randomly assigned to 4 groups (n = 15-18/group) into a 2 (no NMBA vs. NMBA) × 2 (normal RBF vs. RBF-deficient) factorial design, including R6, R0, R6N, and R0N groups. NMBA (0.35 mg/kg body weight) subcutaneous injection 3 times per week for 5 weeks. Rats were euthanized at 25 weeks. (B, left) Exp 2. Forty-three male rats were randomly assigned to 3 groups (n = 12-19/group), including R6N, R0.6N, and R0.06N groups. Rats were euthanized at 35 weeks. (A, B, right) Serum free RBF levels in rats (nM). Values are means ± SD. Exp 1 different letters (a and b for diet effect) are significantly different by two-way ANOVA and LSD test (P < 0.05). Exp 2 different letters (a, b and c) are significantly different from each other by one-way ANOVA and LSD test (P < 0.05).
