
Figure 3.
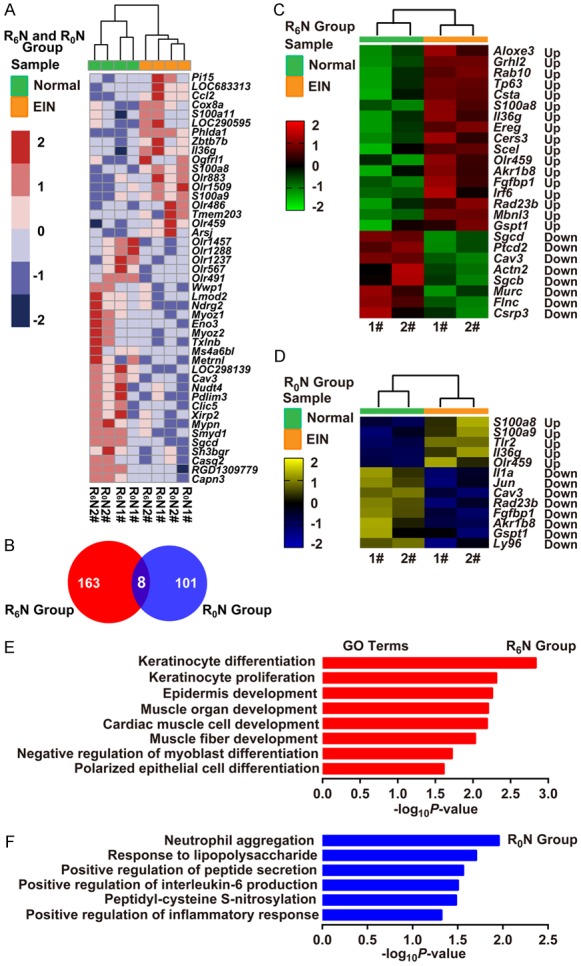
RBF deficiency induces an inflammatory gene expression profile in rat esophageal tumors. (A) Heat map showing gene expression profiling of the EIN vs. Normal tissues in the R6N and R0N groups (n = 2/group). (B) Venn diagram showing the unique and shared differentially-expressed genes between the R6N and R0N groups. (C, D) Heat map showing the differential gene expression profiling of EIN vs. Normal tissues in the R6N (C) and R0N (D) groups, respectively (n = 2/group). Log2-fold change ratios are shown in the results. (E, F) Bar diagrams showing the biological processes in the R6N (E) and R0N (F) groups. Predicted GO categories ranked by enrichment score [-log10 (P-value)]. Up, Up-regulated expression; Down, Down-regulated expression; 1# and 2#, identifier of rats.