
Figure 4.
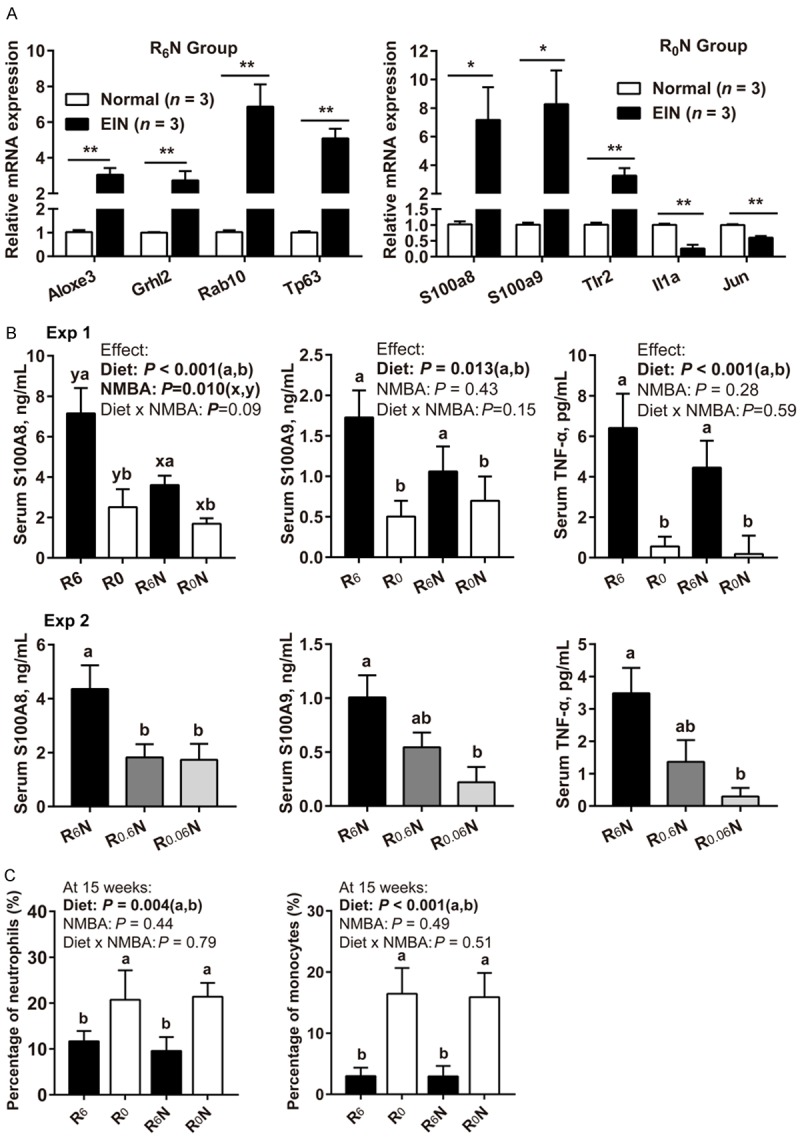
Effect of RBF deficiency on the levels of inflammatory markers in rat esophageal neoplasia tissues and peripheral blood. A. Validation of microarray data by qRT-PCR (EIN vs. Normal tissues, normalized to β-actin, n = 3/group). Data were analyzed by Student’s t-test. B. Detection of inflammatory marker expression levels in rat serum by ELISA (n = 6/group). C. At 15 weeks, the percentage of peripheral blood neutrophils, and monocytes in the total white blood cells (n = 15-18/group). Values are means ± SD. Exp 1 different letters (a and b for diet effect; x and y for NMBA effect) are significantly different by two-way ANOVA and LSD test (P < 0.05). Exp 2 different letters (a and b) are significantly different from each other by one-way ANOVA and LSD test (P < 0.05). *Means differ, P < 0.05. **Means differ, P < 0.01.