Abstract
Recent studies suggest that up-regulated HSF1 possesses metabolic phenotypes switch and chemoresistance in cancer cells. However, the mechanism in which these characteristics are still ambiguous. Our study aims to identify how HSF1 confers chemoresistance through regulating metabolic pathway in hepatocellular carcinoma (HCC). Oxaliplatin (OXA)-resistant HCC cells (HCC-OXR) in both of abundant glucose (AG; 25 mM) and low glucose (LG; 5.5 mM) conditions were constructed; then glucose consumption, lactate production, intracellular ATP level and oxygen consumption of parental and OXA-resistant cells were determined by using the associated detected kits. Moreover, HSF1 was knocked down to analyze its effects on metabolic phenotypes alteration and chemoresistance formation in HCC cells. Compared to cells in AG condition, HCC cells delayed to form chemoresistance to OXA in LG condition; and OXA-resistant cells underwent a metabolic switch from glycolysis to oxidative phosphorylation (OXPHOS), which presented decreased glucose uptake and lactate production with increased levels of oxygen consumption and intercellular ATP; interestingly, this energy-producing pathway was blocked in HSF1-knockdown OXA-resistant cells, especially in LG condition. Analysis on previous data revealed that AMPK pathway was a critical regulator in the metabolism of OXA-resistance HCC cells. Furthermore, AMPKα2 was identified as an important factor regulated by HSF1 to achieve metabolic phenotype switch in OXA-resistance HCC cells. Consequently, these results suggest that combining restrictive glucose uptake and targeting HSF1/AMPKα2 is an attractive strategy to prevent chemoresistance to OXA in HCC patients.
Keywords: Hepatocellular carcinoma, chemoresistance, oxaliplatin, glycolysis, HSF1, AMPK
Introduction
In the past few decades, reprogramming metabolism has become an acknowledged hallmark of malignant tumors [1]. Most of normal cells utilize oxidative phosphorylation (OXPHOS) to acquire energy for growth and proliferation; however, cancer cells switch glucose into lactate toward heighten aerobic glycolysis, as called “Warburg effect” [2,3]. Interestingly, cancer cells cannot obtain sufficient adenosine triphosphate (ATP) generated from glycolysis to maintain their growth and proliferation when chemotherapy and there is an alteration of metabolic pathway in cancer cells with chemoresistance [4-6]. Increasing evidences indicate numerous oncogenes and tumor suppressor genes involve in the reprogramming metabolism [7,8]. Accordingly, targeting these genes and altered metabolic pathways reveals a potential strategy to prevent chemoresistance in cancers.
As the third-generation platinum-derived chemotherapeutic drug, oxaliplatin (OXA) displays its anti-cancer activity to treat hepatocellular carcinoma (HCC) patients in numerous studies [9-11]; however, the pooled response rates of OXA are not more than 20% for patients with advanced HCC [10]. The low response rates partly attribute to chemotherapy resistance, which negatively influences on the recovery rate of OXA-treatment patients [12]. As previous studies showed, acquired resistance to OXA usually contributes to the alterations in OXA transport and detoxification, DNA damage-repair dysfunction, cell death and epigenetic mutations [13]. Nevertheless, it is still unclear that how metabolic phenotypes alter in cancer cells with OXA resistance.
As a pivotal regulator to enhance lifespan of cells, heat shock factor 1 (HSF1), is often overexpressed in HCC and has been demonstrated to involve in the metabolic regulation of HCC [14]. Besides, several studies have revealed that HSF1 directly binds the promoter region of multidrug resistance gene 1 (MDR1) and regulates the expressions of some drug-resistant proteins including P-gp [15], suggesting to promote the development of chemoresistance in cancer cells. Of note, also as an important factor in stress responses, HSF1 connects stress signals with energy metabolic pathways [16-19]. Among numerous energy metabolic pathways, AMPK has been recognized as a critical regulator of energy metabolism in cancers [20]. In mammal, AMPK pathway is activated to strengthen energy production and weaken energy consumption, when intracellular ATP levels reduce in cells, which assisting cancer cells to escape in chemoresistance and promote metastasis [21]. Besides, increased phosphorylated AMPK reduces triglyceride accumulation in liver and is correlated with the development and prognosis of HCC, possibly associated with Serine/Threonine Kinase 11 and tumor protein P53 (TP53) or mTOR/AKT pathways [22-24].
Herein, we investigated that HSF1 mediated the alterations of aerobic glycolysis into OXPHOS, which contributed to the formation of OXA resistant in HCC cells. Notably, we demonstrated that AMPK pathway was closely related to the metabolic regulation of OXR-HCC cells. Our further findings elucidated that AMPKα2 acted as an important mediator during HSF1-mediated metabolic phenotype alteration in OXA-resistance HCC cells.
Materials and methods
Antibodies
Antibodies to MPR1/ABCC1 (#72202), HSF1 (#12972), AMPKα (#5256), phospho-AMPKα (#2532) and AMPK Subunit Antibody Sampler kit (#9839) were obtained from Cell Signaling Technology. Anti-rabbit IgG, HRP-linked secondary antibody (#sc-2004) was purchased from Santa Cruz Biotechnology, Inc.
Cell culture and construction of HCC-OXR cells
Two different HCC cell lines-MHCC97H and Hep3B cells were harvested with trypsin and passaged in cell culture flasks with DMEM medium (both of AG and LG) containing 10% FBS. The construction of MHCC97H-OXR cells followed a reported study [25]. As Figure 1A and 1C showed, every single concentration of OXA in treated cells was defined as one cycle; for MHCC97H cells, one cycle indicated 5 days and for Hep3B cells, one cycle meant 8 days; the initiated treatment concentrations of OXA for MHCC97H cells and Hep3B cells were respectively 2 μM and 1 μM. Besides, we extraly constructed the drug-resistant HCC cell line in LG condition. MHCC97H cells with 6 and 9 treatment cycles of OXA were suspended for next research. The above cells acquired steady resistance to OXA and were renamed MHCC97H-OXR cells and Hep3B-OXR cells; then they were maintained in meida with 5 μM and 1 μM, respectively.
Figure 1.
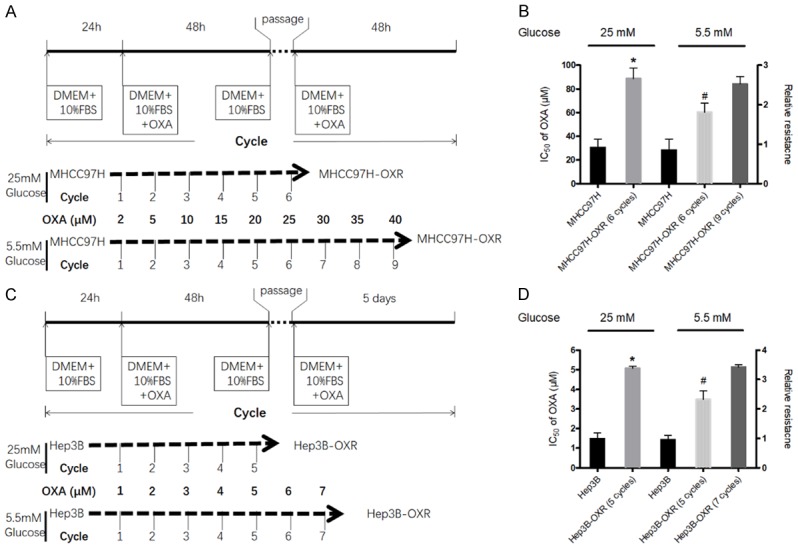
HCC cells underwent the alteration of metabolic phenotype during resistance to OXA. A and C: The procedure of establishing OXA-resistant MHCC97H (MHCC97H-OXR) and Hep3B (Hep3B-OXR) cells. The detail description can be found in the METHODS section. B and D: The IC50s for OXA in MHCC97H vs MHCC97H-OXR cells and Hep3B vs Hep3B-OXR cells in AG (25 mM) and LG (5.5 mM) condition. The left longitudinal axis means the IC50 for OXA; the right longitudinal axis indicates relative resistance based on the definition of HCC cells in AG condition as 1.0. All values represent the mean of three independent experiments.
CCK-8 assay
Cells were plated in 96-well plates (1,000 cells/well) and incubated for 24 h in complete medium. After treatment with OXA, cell viability was measured with the Cell Counting Kit-8 (CCK-8, Dojindo Laboratories, Kumamoto, Japan) according to the manufacturer’s instructions. Briefly, 10 μl CCK-8 solution was added to each well with 100 μl medium without FBS. After incubation at 37°C for 2 h, a microplate reader (Perkin Elmer Victor 3, USA) was used to read the optical density (OD) value at 450 nm. The IC50 values were calculated from the concentration-response curve.
Glucose consumption
The change in glucose uptake by HCC cells was measured by using Glucose Uptake Colorimetric Assay Kit (#K676-100; 100 assays; BioVision; Milpitas, CA, USA) following the manufacturer’s instructions. Absorbance was then measured at 405 nm by using a microplate reader (iMark; Bio-Rad Laboratories, Hercules, CA, USA).
Lactate production
The change in lactate production was determined by using the Lactate Kit (Nangjing Jiancheng Bioengineering, Nanjing, China) according to manufacturer’s protocol. Culture medium was collected for lactate concentration measuring.
ATP production
The ATP production was assayed by the ATP Colorimetric/Fluorometric Assay Kit (ab83355, Abcam Inc.; Cambridge, MA, USA). Harvested cells were washed with cold PBS and centrifuged 2 minutes at 4°C with 13,000 rpm and supernatant was collected and kept on ice. Final measurements were performed with the colorimetric assay according to the manufacturer’s instructions.
Oxygen consumption
The oxygen consumption was measured with an Oxygen Consumption Rate Assay Kit (MitoXpress-Xtra HS Method, Cayman Chemical, Ann Arbor, MI, USA). Cells were seeded in a 96-well plate and cultured overnight. Spent culture medium were removed and replaced by 150 ul of fresh medium. Then, 10 ul MitoXpress-Xtra solution was added to react. Finally, OD value of the plate was read immediately in the PerkinElmer Victor 3 reader (Wellesley, MA, USA).
Cells transfection
The HSF1 and AMPKα2 were knocked down by shRNA transfection in HCC cells. Lentiviral vectors pLKO.1 TRC and pWPI.1 were used for constructing recombinant lentiviruses of short interference RNA (shRNA). HSF1 shRNA (target sequence: 5’-CCGGCAGGAGCAGCTCCTTGAGATTCAAGAGATCTC AAGGAGCTGCTCCTGTTTTTG-3’), AMPKα2 shRNA (targeting the three sequences in the coding region of the AMPKα2 gene [571~591, 1249~1269, 1303~1323]; target sequence 1: 5’-GCAGGTCCTGAAGTTGATATC-3’ [shRNA1]; target sequence 2: 5’-GCTGAAGTTTACCGAGCTATG-3’ [shRNA2]; target sequence 3: 5’-GCATACCATCTTCGTGTAAGA-3’ [shRNA3] and their homologous non-targeting shRNA (shCont). Recombinant lentivirus was amplified in HEK293T cells.
Immunoblotting analysis
Cells were washed with cold PBS and lysed in RIPA lysis buffer containing 1 mM phenylmethylsulfonyl fluoride (PMSF). 20 μg proteins underwent electrophoresis on a 10% SDS-polyacrylamide gel; then the gels were transferred to a 0.45 mm polyvinylidene fluoride membrane (PVDF, Millipore, Billerica, USA) with a Bio-Rad semi-dry instrument. After blocking with 5% BSA in TBS containing 0.1% Tween-20 (TBST) for 1 h at room temperature, the membranes were incubated with a primary antibody overnight at 4°C. After washing with TBST, the membranes were incubated with secondary antibody and performed using the ECL western blot system (Super Signal West Pico Chemiluminescent Substrate, Pierce, Rockford, IL, USA) according to the manufacturer’s instruction. Quantification of western blots was analyzed with QuantityOne software (Bio-Rad Laboratories, Inc., Hercules, CA, USA).
Animal experiments
All animal protocols were approved by the Zhongshan Hospital Institutional Animal Care and Use Committee. Control HCC-OXR cells and treated cells including HCC-OXR, shHSF1-HCC-OXR and shAMPKα-shHSF1-HCC-OXR cells were cultured as described above. These cells in the logarithmic growth phase were collected and digested with a digestive solution containing 0.02% EDTA-0.25% trypsin, and the digestion was terminated by adding DMEM solution containing 10% FBS; cell suspension solution was transferred into a 15 ml Corning centrifuge tube, and centrifuged at 800 rpm for 5 min at 4°C and then resuspended with sterile PBS solution for use. A suspension of PBS containing approximately 5 × 10⁶ HCC cells/0.2 ml was subcutaneously injected into the upper limbs of BALB/c nu/nu nude mice with 4-6 week olds under sterile conditions. After the nude mouse xenograft models were completed, 0.1 ml of oxaliplatin (10 mg/kg) was injected through the tail vein on 7th and 14th day in mice with treatment and the same volume of saline was injected into control mice. The diameter changes and growth curve of xenograft tumors were observed. Mice were humanely euthanized by CO2 asphyxiation and xenograft tumors were completely removed and the volume of tumors was calculated.
Statistical analysis
Statistical analysis was performed with SPSS 19.0 software (SPSS, Chicago, IL, USA). Student’s t-test was used in two-group comparisons; nonparametric methods including Wilcoxon rank test were applied with time as a covariance. P < 0.05 or < 0.01 was considered as significant difference or extremely significant difference, respectively.
Results
HCC cells underwent the switch from glycolysis to OXPHOS during the development of resistance to OXA
MHCC97H and Hep3B cells were discontinuously exposed to incremental doses of OXA over several treatment cycles (Figure 1A, 1C), the MHCC97H-OXR cells and Hep3B-OXR cells were successfully established until 25 μM OXA (6-cycle treatment) and 5 μM OXA (5-cycle treatment) in AG condition, respectively. Then, the half maximal growth inhibitory concentrations (IC50) of OXA were compared between HCC-OXR cells and the parental cells. It was observed that in medium with AG, IC50 of OXA in MHCC97H and Hep3B cells increased observably after 6 treatment cycles (IC50: MHCC97H-OXR cells, 88.60 ± 8.87 μM, parental MHCC97H cells, 30.46 ± 7.06 μM, P < 0.05) and 5 treatment cycles (IC50: Hep3B-OXR cells, 1.47 ± 0.31 μM, parental Hep3B cells, 5.07 ± 0.10 μM, P < 0.05); in contrast, in the LG condition, the IC50s of MHCC97H and Hep3B cells treated OXA with 6 cycles and 5 cycles were respectively 60.36 ± 7.81 μM and 3.48 ± 0.44 μM (Figure 1B, 1D), and it was after 9 and 7 treatment cycles in LG condition that IC50 of MHCC97H and Hep3B cells to OXA achieved respectively equally to those of MHCC97H and Hep3B to OXA after 6 and 5 treatment cycles in AG condition, which suggested that HCCOXR cells generation required more OXA-treatment cycles in LG condition than that in AG condition. At the molecular level, it was also observed that chemoresistance-related molecules-MDR1 and ABCC2 mRNA levels were significantly increased in HCC-OXR cells; the MRP1/ABCC1 protein level of OXA-resistance cells was higher than that of the parental HCC cells (Supplementary Figure 1).
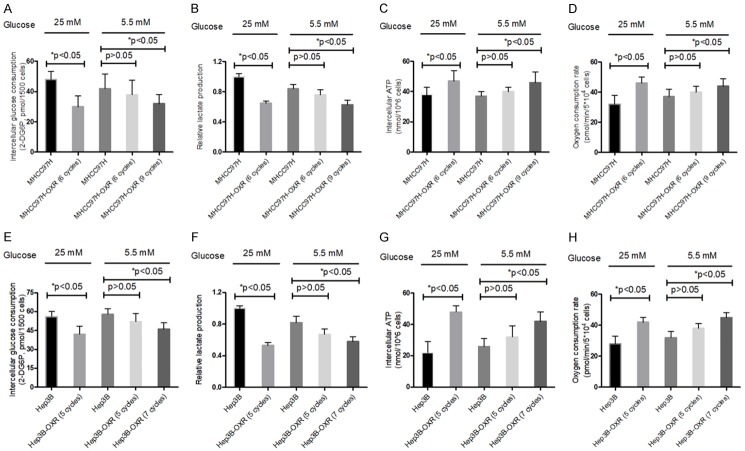
Several studies indicate that chemoresistance accompanies with the metabolic reprogramming involved in energy conversion [4,26], but the intranel relationship is unclear. To investigate the metabolism phenotypes alteration of HCC cells during the development of chemoresistance to OXA, we detected four metabolic indictors (glucose consumption, lactate production, intracellular ATP levels and oxygen consumption) in parental HCC (MHCC97H, Hep3B) and MHCC97H-OXR (MHCC97H-OXR, Hep3B-OXR) cells. For glucose consumption and lactate production, those of HCC-OXR (MHCC97H-OXR, Hep3B-OXR) cells were significantly decreased compared to the parental HCC (MHCC97H-OXR, Hep3B-OXR) cells (both of P < 0.05) in AG condition; while there was no significant difference in those of HCC-OXR and HCC cells (both of P > 0.05) in LG condition, but after more cycles, they were significantly decreased in the HCC-OXR cells (both of P < 0.05) (Figure 2A, 2B). For the levels of intracellular ATP and oxygen consumption, those in HCC-OXR (MHCC97H-OXR, Hep3B-OXR) cells were significantly higher than those in parental HCC (MHCC97H, Hep3B) cells (both of P < 0.05) in AG condition; but no significant difference was found in those of MHCC97H-OXR (6 cycles) and parental MHCC97H cells or Hep3B-OXR (5 cycles) and parental Hep3B cells (both of P > 0.05), as similar to glucose consumption and lactate production, they displayed significant difference between HCC-OXR cells with more treatment cycles and parental HCC cells (P < 0.05) (Figure 2C, 2D). These results indicated that no matter cells were cultured in AG or LG condition, HCC cells underwent metabolic alteration in the development of resistance to OXA.
Figure 2.
Metabolic parameters alteration in parental HCC cells (MHCC97H, Hep3B) and HCC-OXR (MHCC97H-OXR, Hep3B-OXR) cells when cultured in AG (25 mM) and LG (5.5 mM) condition. Glucose consumption (A and E), lactate production (B and F) and intracellular ATP levels (C and G), oxygen consumption (D and H) of HCC (MHCC97H and Hep3B, respectively) cells and HCC-OXR (MHCC97H-OXR, Hep3B-OXR) cells were determined by using the associated methods described in METHODS section. All values represent the mean of three independent experiments. *P < 0.05.
HSF1 depletion inhibited the alteration of metabolic phenotypes in OXA-resistance HCC cells
Recent studies suggest that HSF1 regulates the expression of MDR and participates in chemoresistance of cancer cells [27]. Herein, we sought to explore more underlying roles of HSF1 in chemotherapy resistance of HCC. Firstly, it was observed HSF1 was significantly upregulated in HCC-OXR cells compared to the parental HCC cells both in of AG and LG conditions (Figure 3A-E). Next, HSF1 was significantly knocked down in HCC (MHCC97H and Hep3B) cells (Figure 3C, 3F); then shHSF1-HCC cells were cultured in AG and LG medium respectively with cumulative concentration of OXA and the acquired OXA-resistance shHSF1-HCC cells were constructed and IC50s of OXA in shHSF1-HCC cells with indicated cycles of OXA treatment were determined; in detail, in AG condition, the IC50 of OXA in shHSF1-MHCC97H cells didn’t reach up to IC50 value as in MHCC97H-OXR cells, after 6 cycles treatment (50.33 ± 7.83 μM vs 88.62 ± 3.81 μM), even 9 cycles treatment with maximum escalated concentration of 40 μM OXA (66.93 ± 4.13 μM vs 88.62 ± 3.81 μM). Moreover, compared with that in AG condition, the IC50 of OXA in shHSF1-MHCC97H cells cultured in LG condition was more significantly decreased after 6 cycles treatment (50.33 ± 7.83 μM vs 31.67 ± 5.25 μM) or 9 cycles treatment (50.33 ± 7.83 μM vs 34.73 ± 9.28 μM) and maintained no significantly different low values of IC50 at the times of 6 cycles treatment and 9 cycles treatment (Figure 3G). For shHSF1-Hep3B cells, similar features on IC50 were found during the development of resistance to OXA (Figure 3J). These findings suggested that, although HSF1 existence contributed to the development of HCC cells resistance to OXA both in AG and LG conditions, HSF1 knockdown could block the developmental process of resistance to OXA in LG condition and delay the generation of OXA resistant in AG condition. Moreover, in vivo animal models assay showed OXA-resistance shHSF1-HCC cells delayed the tumor growth and formed smaller tumors (P < 0.05), in comparison with HCC-OXR cells (Figure 3H-L).
Figure 3.
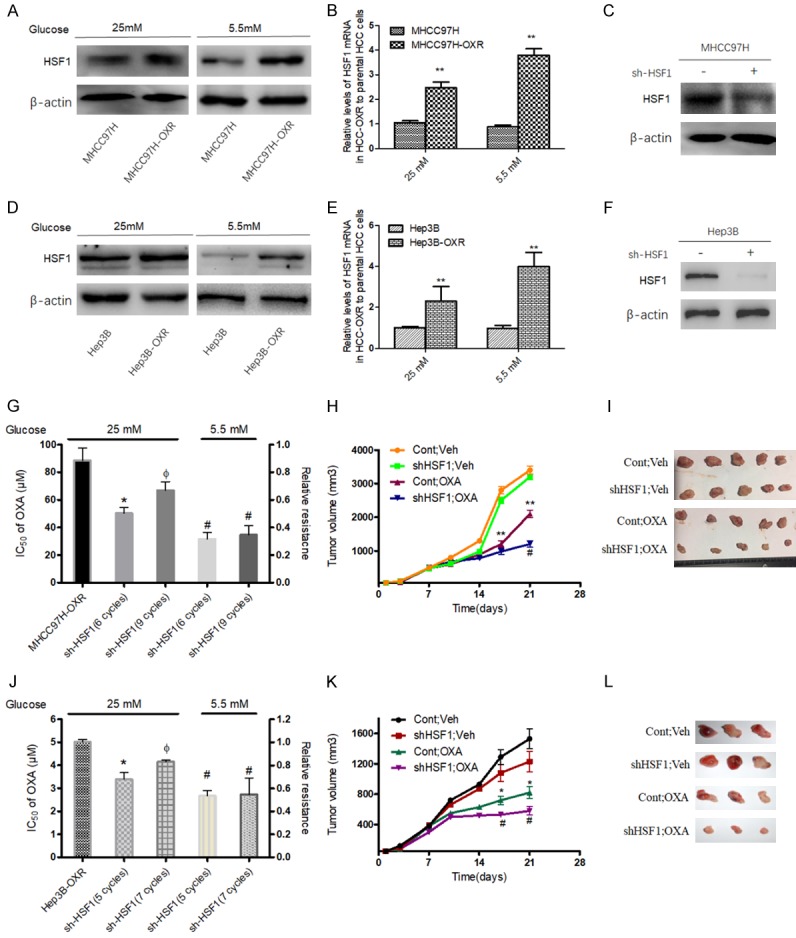
Expression of HSF1 in parental HCC cells and HCC-OXR cells and effect of HSF1 knockdown on the resistance to OXA. Protein level (A, D) and mRNA level (B, E) of HSF1 were increased in HCC-OXR cells compared with parental HCC cells. **P < 0.01. After HSF1 effective knockdown (C, F), the relative resistance to OXA was decreased in AG (25 mM) and LG (5.5 mM) condition; *P < 0.05 vs HCC-OXR, ФP < 0.05 vs shHSF1-HCC (with 6 cycles treatment in MHCC97H or with 5 cycles treatment in Hep3B) in AG condition, #P < 0.05 in LG condition vs the corresponding shHSF1-HCC with same cycles treatment in AG condition (G, J). (H, I, K, L) HCC-OXR and shHSF1-HCC-OXR cells were used for establishing human liver cancer nude mouse xenograft models and these mice were divided into four groups: HCC-OXR with saline treatment (Cont; Veh), shHSF1-HCC-OXR with saline treatment (shHSF1; Veh), HCC-OXR with OXA treatment (Cont; OXA) and shHSF1-HCC-OXR with OXA treatment (shHSF1; OXA). The growth of xenograft tumor (H, K) and tumor volume (I, L) among the four groups were comparatively analyzed. **P < 0.01, *P < 0.05 vs Cont; Veh; #P < 0.05 vs Cont; OXA.
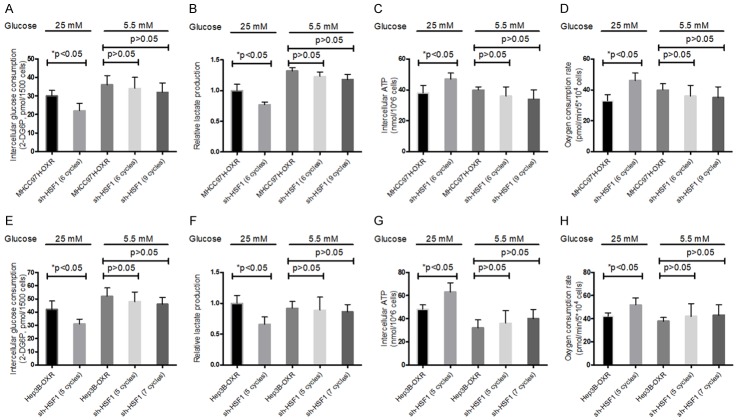
In addition, it was further observed that, in LG condition, shHSF1-HCC- cells didn’t display significant decrease in glucose restriction, lactate production and increase in oxygen consumption level and intercellular ATP levels, compared with controls. In contrast, in AG condition, shHSF1-HCC cells showed still significant decreased glucose consumption, lactate production and increased oxygen consumption and intercellular ATP levels (Figure 4). These results suggested that, during resistance to OXA, metabolic alteration of HCC cells might be dependent on HSF1 existence in LG condition, but non-dependent on HSF1 expression in AG condition.
Figure 4.
Effect of HSF1 knockdown in HCC cells on metabolic factors. Glucose consumption (A and E), lactate production (B and F) and intracellular ATP levels (C and G), oxygen consumption (D and H) of HCC-OXR cells (MHCC97-OXR and Hep3B-OXR, respectively) and shHSF1-HCC cells were determined by using the associated methods described in METHODS section. All values represent the mean of three independent experiments. *P < 0.05.
HSF1 regulates AMPK pathway in OXA-resistance HCC cells
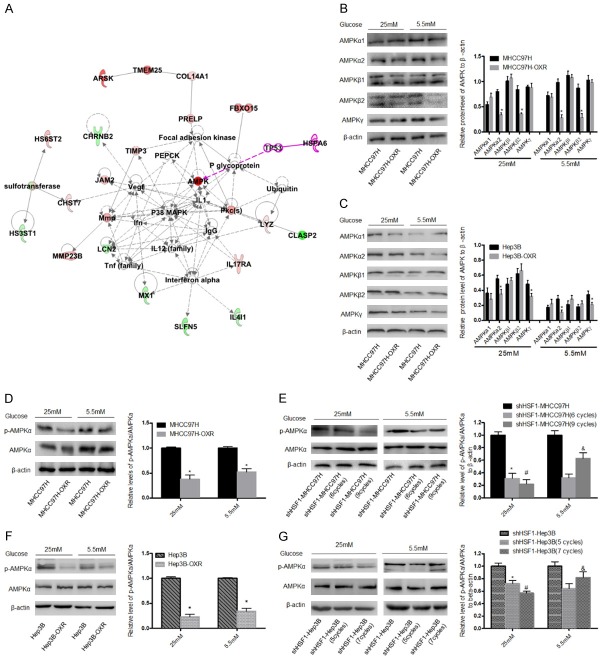
To investigate the molecular mechanism in which HSF1 involved in the development of promoting chemoresistance of HCC cells, we performed an ingenuity pathway analysis (IPA) with a reported data from Gene Expression Omnibus database (GSE51951), which is based on the OXA-resistant and control tumors formed from HCC cells-xenograft models [28], and finally recognized that AMPK involved in the network of carbohydrate metabolism (Figure 5A), suggesting AMPK pathway was an important node to adjust the metabolism in the formation of OXA-resistance HCC cells. Numerous studies have demonstrated that AMPK is a critical regulator of energy metabolism in cancers; in response to decreased intracellular ATP level, AMPK pathway was activated to promote energy production and suppress energy consumption [20]. AMPK is a heterotrimeric protein consisting of a catalytic subunit (α) and two regulatory subunits (β and γ) [24,29,30]. Thus, we sought to determine the protein levels of these AMPK subunits in OXA-resistance HCC cells. As shown in Figure 5B, 5C, regardless of AG or LG condition, the significant downregulation of AMPKα2 was detected in MHCC97H-OXR and Hep3B-OXR cells, meanwhile the significant downregulation of AMPKβ2 in MHCC97H-OXR cells and AMPKγ in Hep3B cells were found; but no significant difference in other AMPKs expressions between the parental HCC and HCC-OXR cells. Furthermore, regardless of glucose condition, p-AMPKα/AMPKα ratio was decreased in HCC-OXR cells, compared to HCC cells (Figure 5D, 5F). To further investigate the effect of HSF1 on the activation of AMPK pathway in the development of resistance to OXA in HCC cells, we observed the p-AMPKα/AMPKα ratio in shHSF1-HCC and shHSF1-HCC-OXR cells and found that in AG condition, p-AMPKα/AMPKα ratio was decreased in shHSF1-HCC-OXR cells as compared with shHSF1-HCC cells (Figure 5E, 5G).
Figure 5.
AMPK pathway is involved in HSF1-mediated metabolic phenotype switch in OXA-resistance HCC cells. (A) Corresponding network by IPA analysis based on the different expression genes of HCC cells and HCC-OXR cells indicated AMPK pathway is a critical node during the forming of resistance to OXA. Various subunits including α1, α2, β1, β2 and γ (B, C) and p-AMPKα/AMPKα ratio (D-F) in HCC and HCC-OXR cells were detected in AG and LG condition by using western blot. *P < 0.05. Moreover, p-AMPKα/AMPKα ratio was further detected in HSF1-knockdown parental HCC and shHSF1-HCC cells with OXA treatment in AG and LG condition (F, G). *P < 0.05 vs shHSF1-HCC and #P < 0.05 vs shHSF1-HCC (MHCC97H: 6 cycles; Hep3B: 5 cycles) in AG condition; &P < 0.05 vs shHSF1-HCC (MHCC97H: 6 cycles; Hep3B: 5 cycles) in LG condition.
Unexpectedly, in the LG medium, p-AMPKα/AMPKα ratio was increased in shHSF1-HCC cells with more cycles OXA treatment, compared to shHSF1-HCC cells with less cycles OXA treatment (Figure 5E, 5G). These results suggested that HSF1 promotes resistance to OXA via regulating AMPK activity; further exploration is required on the underlying mechanism how HSF1 regulates AMPK pathway in the development of chemoresistance of HCC cells.
HSF1 regulates AMPKα2 to achieve metabolic phenotypes alteration in OXA-resistance HCC cells
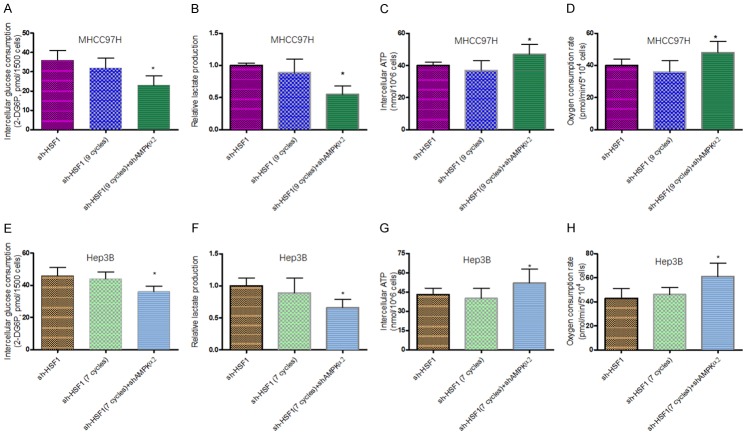
It is recently reported that HSF1 inhibition accelerates AMPK activation to suppress tumor cell growth and proliferation [31]. To validate the relationship of HSF1 and specific AMPK subunits in OXR-HCC cells in this study, we firstly observed the change of a variety of AMPK subunits in shHSF1-HCC-OXR cells, compared to HCC-OXR cells. It was found that AMPKα2 was significantly upregulated whereas no significant difference in levels of AMPKα1, AMPKβ1, AMPKβ2 and AMPKγ between shHSF1-HCC-OXR and HCC-OXR cells in AG condition; meanwhile, only slightly decreased AMPKα2 in shHSF1-HCC-OXR cells was observed in LG condition (Figure 6A, 6B, 6D and 6E), suggesting HSF1 poses a targeted negative regulation on AMPKα2 level in OXA-resistance HCC cells and there was a difference between in AG and LG conditions. Then, to further elucidate the negative effect of HSF1 on AMPKα2 in HCC-OXR cells, AMPKα2 was knocked down in shHSF1-MHCC97H-OXR cells (Supplementary Figure 2); the IC50s of OXA in AMPKα2 knockdown shHSF1-HCC-OXR cells increased significantly in either AG condition and LG condition, even up to the level of HCC-OXR cells (Figure 6C, 6F). Further analysis was executed in the nude mouse xenograft model. With the parallel OXA treatment, HCC-OXR cells with dual depletion of HSF1 and AMPKα2 grew faster and developed much larger tumor than HCC-OXR cells with only HSF1 depletion (Figure 6G, 6H). As mentioned above, it indicated that restrictive glucose consumption contributed to sensitize HSF1-deleted HCC cells to OXA treatment. Accordingly, to define the effects of AMPKα2 on the metabolic alteration of HCC-OXR cells with HSF1 depletion in glucose-limited condition. We examined the metabolic alteration of shHSF1-HCC-OXR cells with AMPKα2 knockdown, compared to shHSF1-HCC and shHSF1-HCC-OXR cells, in LG condition and it was observed that decreased glucose uptake and lactate production with increases ATP production and oxygen consumption in shHSF1-HCC-OXR cells following AMPKα2 depletion (Figure 7).
Figure 6.
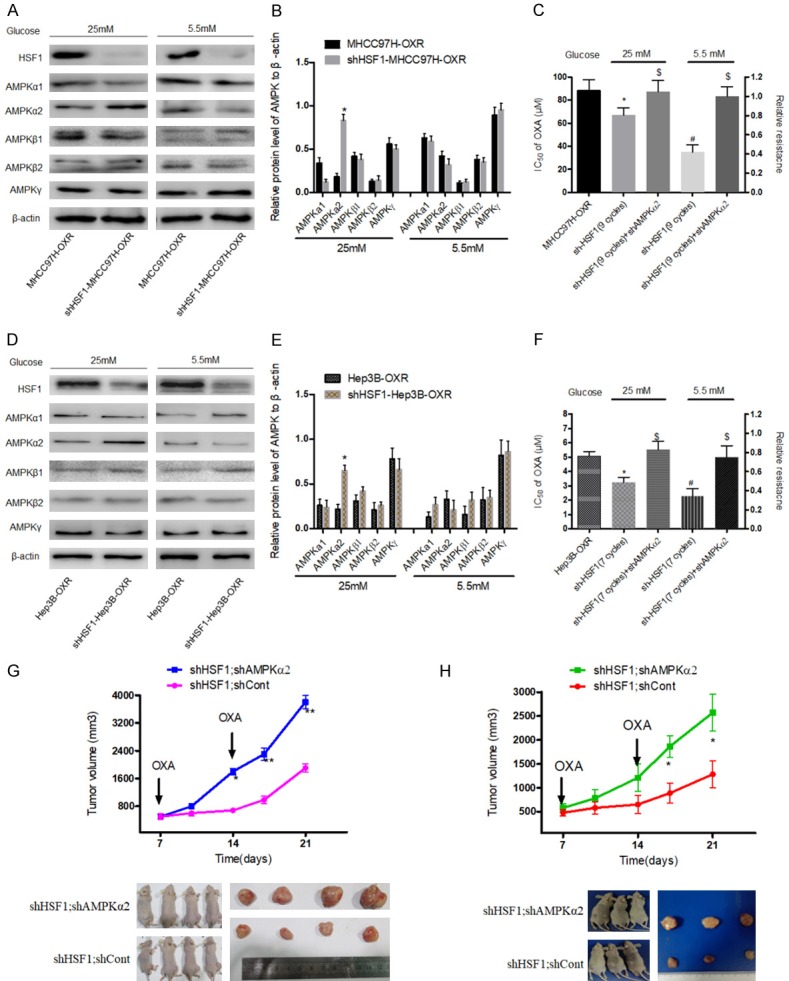
HSF1-mediated effects in OXA-resistance HCC cells were depended on AMPKα2. A, B, D, E: In AG and LG condition, protein levels of various AMPK subunits including α1, α2, β1, β2 and γ were detected in HCC-OXR cells after HSF1 knockdown. *P < 0.05. C, F: AMPKα2 was efficiently knocked down in shHSF1-HCC (MHCC97H: 9 cycles OXA treatment; Hep3B: 7 cycles OXA treatment) in AG and LG condition and IC50 was calculated. *P < 0.05 vs HCC-OXR in AG condition and #P < 0.05 vs HCC-OXR in LG condition; $P > 0.05 vs HCC-OXR in AG and LG condition. G, H: shHSF1-HCC-OXR (shHSF1; shCont) and shAMPKα2-shHSF1-HCC-OXR (shHSF1; shAMPKα2) cells were used for establishing human liver cancer nude mouse xenograft models. The growth of xenograft tumor and tumor volume between the two groups were comparatively analyzed. *P < 0.05; **P < 0.01.
Figure 7.
Effect of AMPKα2 knockdown in shHSF1-HCC with OXA treatment cells on metabolic factors. Glucose consumption (A and E), lactate production (B and F) and intracellular ATP levels (C and G), oxygen consumption (D and H) of shHSF1-HCC cells, shHSF1-HCC cells with indicated OXA treatment and shHSF1-HCC+shAMPKα2 cells were determined by using the associated methods described in METHODS section. All values represent the mean of three independent experiments. *P < 0.05.
Discussion
As one first-line drug for cancer chemotherapy, OXA displays the anti-cancer effects on numerous cancers including HCC [11]. However, studies show that resistance to OXA is still a major challenge for those HCC patients to achieve effective efficacy when receiving chemotherapy [13]. In our study, when constructing the HCC-OXR cells with the exposing increased concentration of OXA, we observed that increased treatment cycles were required for generating successfully HCC-OXR cells in LG condition, which is consistent with the consequences of several studies [32]. Furthermore, we observed that HCC-OXR cells presented decreased glucose uptake and lactate production with increased ATP production and oxygen consumption in AG condition; however, no significant difference was detected in the four indictors (glucose uptake, lactate production, ATP production and oxygen consumption) between the parental HCC and HCC-OXR cells in LG condition. Together, these results suggested limited glucose uptake delayed the generation of chemoresistance in HCC cells.
Increasing evidences demonstrate that HSF1 accelerates the chemoresistance in cancers by binding with MDR1 and regulating resistance related protein [19,27]. In our study, after HSF1 was knocked down in HCC cells, we found HSF1 depletion delayed the process of resistance to OXA in HCC cells when performing OXA resistance induction. Besides, HCC-OXR cells with HSF1 knockdown cannot product efficient ATP to adapt chemotherapy stress, especially in LG condition, suggesting that HSF1 is an importance factor to drive energy metabolism alteration in resistance to OXA. Targeting on HSF1 might be an effective strategy to enhance the sensibility to chemotherapeutics.
According to the results of IPA with a gene microarray (GSE51951) previously reported by us, AMPK signaling was identified as one of critical pathway in the energy metabolism of OXR cells. It has indicated that enhanced stemness with AMPK activation was detected in OXA-resistance HCC cells; AMPK inhibitors suppressed the generation of hematopoietic stem cells, suggesting that AMPK pathway was involved in the self-renewing and chemoresistance generating of cancer cells [25,33]. Confusingly, several studies also found that metformin, an AMPK activator, can sensitize the chemotherapy of breast and prostate cancers and inhibit the growth of tumor stem cells [34,35]. Therefore, further researches need to be executed on the mechanism of AMPK signaling in chemoresistance in HCC cells. Herein, we demonstrated AMPKα2 level as well as p-AMPKα/AMPKα were decreased in HCC-OXR cells, in comparation to the parental cells; but some difference existed between MHCC97H and Hep3B, for example, the significant downregulation of AMPKβ2 in MHCC97H-OXR cells and AMPKγ in Hep3B cells, which may be associated with the heterogeneity of tumor cell lines, such as P53 mutations. Moreover, we observed that p-AMPKα/AMPKα ratio and AMPKα2 was upregulated in HCC-OXR cells with HSF1 depletion and after AMPKα2 depletion in shHSF1-HCC-OXR cells, these cells grew faster and developed much larger tumor and experienced metabolic alteration. These results revealed that AMPKα2 depletion reversed the sensitivity to OXA treatment in HSF1-defected HCC-OXR cells and AMPKα2 played a negative role in HSF1 promoting chemoresistance of HCC cells to OXA.
In summary, our findings unravel the association between glycolysis to OXPHOS switch and OXA-resistance in HCC cells and unveil a key role of HSF1 in the forming of HCC cells resistance to OXA treatment, and uncover also a novel mechanism of HSF1 regulating AMPK pathway activity, particularly AMPKα2, which involved in metabolic phenotype alteration during the chemoresistance. These findings may not only improve our understanding of HCC chemoresistance, but may provide novel insight for developing new therapeutic strategies, for instance, combining restrictive glucose uptake with targeting HSF1/AMPKα2 will be an attractive strategy to sensitize OXA-treatment in HCC. Nevertheless, there are some limitations in our study, which will be improved in the future. For example, these findings need to be validated in more HCC cell lines and clinical samples; which cytokines and/or chemokines will be involved in the molecular mechanism of HSF1 regulating AMPKα2.
Acknowledgements
We thank Miss. Jie Chen and Yan Zhao for their kind cell culture work regarding to this study. This study was supported by National Natural Science Foundation of China (No. 81872492), National Key Research and Development Program of China (2018YFC0910700) and Shanghai Pujiang Program (No. 15PJD007).
Disclosure of conflict of interest
None.
Supporting Information
References
- 1.Li Z, Zhang H. Reprogramming of glucose, fatty acid and amino acid metabolism for cancer progression. Cell Mol Life Sci. 2016;73:377–392. doi: 10.1007/s00018-015-2070-4. [DOI] [PMC free article] [PubMed] [Google Scholar]
- 2.Koppenol WH, Bounds PL, Dang CV. Otto Warburg’s contributions to current concepts of cancer metabolism. Nat Rev Cancer. 2011;11:325–337. doi: 10.1038/nrc3038. [DOI] [PubMed] [Google Scholar]
- 3.DeBerardinis RJ, Chandel NS. Fundamentals of cancer metabolism. Sci Adv. 2016;2:e1600200. doi: 10.1126/sciadv.1600200. [DOI] [PMC free article] [PubMed] [Google Scholar]
- 4.Lin J, Xia L, Liang J, Han Y, Wang H, Oyang L, Tan S, Tian Y, Rao S, Chen X, Tang Y, Su M, Luo X, Wang Y, Wang H, Zhou Y, Liao Q. The roles of glucose metabolic reprogramming in chemo- and radio-resistance. J Exp Clin Cancer Res. 2019;38:218. doi: 10.1186/s13046-019-1214-z. [DOI] [PMC free article] [PubMed] [Google Scholar]
- 5.Yoo SH, Kang SY, Cheon GJ, Oh DY, Bang YJ. Predictive role of temporal changes in intratumoral metabolic heterogeneity during palliative chemotherapy in patients with advanced pancreatic cancer: a prospective cohort study. J Nucl Med. 2019 doi: 10.2967/jnumed.119.226407. [Epub ahead of print] [DOI] [PMC free article] [PubMed] [Google Scholar]
- 6.Vellinga TT, Borovski T, de Boer VC, Fatrai S, van Schelven S, Trumpi K, Verheem A, Snoeren N, Emmink BL, Koster J, Rinkes IH, Kranenburg O. SIRT1/PGC1alpha-dependent increase in oxidative phosphorylation supports chemotherapy resistance of colon cancer. Clin Cancer Res. 2015;21:2870–2879. doi: 10.1158/1078-0432.CCR-14-2290. [DOI] [PubMed] [Google Scholar]
- 7.Troncone M, Cargnelli SM, Villani LA, Isfahanian N, Broadfield LA, Zychla L, Wright J, Pond G, Steinberg GR, Tsakiridis T. Targeting metabolism and AMP-activated kinase with metformin to sensitize non-small cell lung cancer (NSCLC) to cytotoxic therapy: translational biology and rationale for current clinical trials. Oncotarget. 2017;8:57733–57754. doi: 10.18632/oncotarget.17496. [DOI] [PMC free article] [PubMed] [Google Scholar]
- 8.Kamp WM, Wang PY, Hwang PM. TP53 mutation, mitochondria and cancer. Curr Opin Genet Dev. 2016;38:16–22. doi: 10.1016/j.gde.2016.02.007. [DOI] [PMC free article] [PubMed] [Google Scholar]
- 9.Schokker S, van der Woude SO, van Kleef JJ, van Zoen DJ, van Oijen MGH, Mearadji B, Beenen LFM, Stroes CI, Waasdorp C, Jibodh RA, Creemers A, Meijer SL, Hooijer GKJ, Punt CJA, Bijlsma MF, van Laarhoven HWM. Phase I dose escalation study with expansion cohort of the addition of Nab-Paclitaxel to capecitabine and Oxaliplatin (CapOx) as first-line treatment of metastatic esophagogastric adenocarcinoma (ACTION Study) Cancers (Basel) 2019;11 doi: 10.3390/cancers11060827. [DOI] [PMC free article] [PubMed] [Google Scholar]
- 10.Yen Y, Lim DW, Chung V, Morgan RJ, Leong LA, Shibata SI, Wagman LD, Marx H, Chu PG, Longmate JA, Lenz HJ, Ramanathan RK, Belani CP, Gandara DR. Phase II study of oxaliplatin in patients with unresectable, metastatic, or recurrent hepatocellular cancer: a California Cancer Consortium Trial. Am J Clin Oncol. 2008;31:317–322. doi: 10.1097/COC.0b013e318162f57d. [DOI] [PubMed] [Google Scholar]
- 11.Lyu N, Kong Y, Pan T, Mu L, Li S, Liu Y, Deng H, Li J, Shi M, Xu L, Guo R, Chen M, Wu P, Zhao M. Hepatic arterial infusion of oxaliplatin, fluorouracil, and leucovorin in hepatocellular cancer with extrahepatic spread. J Vasc Interv Radiol. 2019;30:349–357. doi: 10.1016/j.jvir.2018.09.004. [DOI] [PubMed] [Google Scholar]
- 12.Qin S, Cheng Y, Liang J, Shen L, Bai Y, Li J, Fan J, Liang L, Zhang Y, Wu G, Rau KM, Yang TS, Jian Z, Liang H, Sun Y. Efficacy and safety of the FOLFOX4 regimen versus doxorubicin in Chinese patients with advanced hepatocellular carcinoma: a subgroup analysis of the EACH study. Oncologist. 2014;19:1169–1178. doi: 10.1634/theoncologist.2014-0190. [DOI] [PMC free article] [PubMed] [Google Scholar]
- 13.Martinez-Balibrea E, Martínez-Cardús A, Ginés A, Ruiz de Porras V, Moutinho C, Layos L, Manzano JL, Bugés C, Bystrup S, Esteller M, Abad A. Tumor-related molecular mechanisms of oxaliplatin resistance. Mol Cancer Ther. 2015;14:1767–1776. doi: 10.1158/1535-7163.MCT-14-0636. [DOI] [PubMed] [Google Scholar]
- 14.Liu D, Sun L, Qin X, Liu T, Zhang S, Liu Y, Li S, Guo K. HSF1 promotes the inhibition of EMT-associated migration by low glucose via directly regulating Snail1 expression in HCC cells. Discov Med. 2016;22:87–96. [PubMed] [Google Scholar]
- 15.Kioka N, Yamano Y, Komano T, Ueda K. Heat-shock responsive elements in the induction of the multidrug resistance gene (MDR1) FEBS Lett. 1992;301:37–40. doi: 10.1016/0014-5793(92)80205-u. [DOI] [PubMed] [Google Scholar]
- 16.Sawai M, Ishikawa Y, Ota A, Sakurai H. The proto-oncogene JUN is a target of the heat shock transcription factor HSF1. FEBS J. 2013;280:6672–6680. doi: 10.1111/febs.12570. [DOI] [PubMed] [Google Scholar]
- 17.Zhang N, Wu Y, Lyu X, Li B, Yan X, Xiong H, Li X, Huang G, Zeng Y, Zhang Y, Lian J, Ni Z, He F. HSF1 upregulates ATG4B expression and enhances epirubicin-induced protective autophagy in hepatocellular carcinoma cells. Cancer Lett. 2017;409:81–90. doi: 10.1016/j.canlet.2017.08.039. [DOI] [PubMed] [Google Scholar]
- 18.Engerud H, Tangen IL, Berg A, Kusonmano K, Halle MK, Oyan AM, Kalland KH, Stefansson I, Trovik J, Salvesen HB, Krakstad C. High level of HSF1 associates with aggressive endometrial carcinoma and suggests potential for HSP90 inhibitors. Br J Cancer. 2014;111:78–84. doi: 10.1038/bjc.2014.262. [DOI] [PMC free article] [PubMed] [Google Scholar]
- 19.Gokmen-Polar Y, Badve S. Upregulation of HSF1 in estrogen receptor positive breast cancer. Oncotarget. 2016;7:84239–84245. doi: 10.18632/oncotarget.12438. [DOI] [PMC free article] [PubMed] [Google Scholar]
- 20.Jeon SM. Regulation and function of AMPK in physiology and diseases. Exp Mol Med. 2016;48:e245. doi: 10.1038/emm.2016.81. [DOI] [PMC free article] [PubMed] [Google Scholar]
- 21.Jin L, Chun J, Pan C, Kumar A, Zhang G, Ha Y, Li D, Alesi GN, Kang Y, Zhou L, Yu WM, Magliocca KR, Khuri FR, Qu CK, Metallo C, Owonikoko TK, Kang S. The PLAG1-GDH1 axis promotes anoikis resistance and tumor metastasis through CamKK2-AMPK signaling in LKB1-deficient lung cancer. Mol Cell. 2018;69:87–99. doi: 10.1016/j.molcel.2017.11.025. [DOI] [PMC free article] [PubMed] [Google Scholar]
- 22.Umezawa S, Higurashi T, Nakajima A. AMPK: therapeutic target for diabetes and cancer prevention. Curr Pharm Des. 2017;23:3629–3644. doi: 10.2174/0929867324666170713150440. [DOI] [PubMed] [Google Scholar]
- 23.Park KG, Min AK, Koh EH, Kim HS, Kim MO, Park HS, Kim YD, Yoon TS, Jang BK, Hwang JS, Kim JB, Choi HS, Park JY, Lee IK, Lee KU. Alpha-lipoic acid decreases hepatic lipogenesis through adenosine monophosphate-activated protein kinase (AMPK)-dependent and AMPK-independent pathways. Hepatology. 2008;48:1477–1486. doi: 10.1002/hep.22496. [DOI] [PubMed] [Google Scholar]
- 24.Wang Z, Wang N, Liu P, Xie X. AMPK and cancer. Exp Suppl. 2016;107:203–226. doi: 10.1007/978-3-319-43589-3_9. [DOI] [PubMed] [Google Scholar]
- 25.Bu Y, Jia QA, Ren ZG, Zhang JB, Jiang XM, Liang L, Xue TC, Zhang QB, Wang YH, Zhang L, Xie XY, Tang ZY. Maintenance of stemness in oxaliplatin-resistant hepatocellular carcinoma is associated with increased autocrine of IGF1. PLoS One. 2014;9:e89686. doi: 10.1371/journal.pone.0089686. [DOI] [PMC free article] [PubMed] [Google Scholar]
- 26.Chakraborty PK, Mustafi SB, Xiong X, Dwivedi SKD, Nesin V, Saha S, Zhang M, Dhanasekaran D, Jayaraman M, Mannel R, Moore K, McMeekin S, Yang D, Zuna R, Ding K, Tsiokas L, Bhattacharya R, Mukherjee P. MICU1 drives glycolysis and chemoresistance in ovarian cancer. Nat Commun. 2017;8:14634. doi: 10.1038/ncomms14634. [DOI] [PMC free article] [PubMed] [Google Scholar]
- 27.Barna J, Csermely P, Vellai T. Roles of heat shock factor 1 beyond the heat shock response. Cell Mol Life Sci. 2018;75:2897–2916. doi: 10.1007/s00018-018-2836-6. [DOI] [PMC free article] [PubMed] [Google Scholar]
- 28.Kramer A, Green J, Pollard J Jr, Tugendreich S. Causal analysis approaches in ingenuity pathway analysis. Bioinformatics. 2014;30:523–530. doi: 10.1093/bioinformatics/btt703. [DOI] [PMC free article] [PubMed] [Google Scholar]
- 29.Ke R, Xu Q, Li C, Luo L, Huang D. Mechanisms of AMPK in the maintenance of ATP balance during energy metabolism. Cell Biol Int. 2018;42:384–392. doi: 10.1002/cbin.10915. [DOI] [PubMed] [Google Scholar]
- 30.Lin SC, Hardie DG. AMPK: sensing glucose as well as cellular energy status. Cell Metab. 2018;27:299–313. doi: 10.1016/j.cmet.2017.10.009. [DOI] [PubMed] [Google Scholar]
- 31.Dai S, Tang Z, Cao J, Zhou W, Li H, Sampson S, Dai C. Suppression of the HSF1-mediated proteotoxic stress response by the metabolic stress sensor AMPK. EMBO J. 2015;34:275–293. doi: 10.15252/embj.201489062. [DOI] [PMC free article] [PubMed] [Google Scholar]
- 32.Zhao W, Chen R, Zhao M, Li L, Fan L, Che XM. High glucose promotes gastric cancer chemoresistance in vivo and in vitro. Mol Med Rep. 2015;12:843–850. doi: 10.3892/mmr.2015.3522. [DOI] [PMC free article] [PubMed] [Google Scholar]
- 33.Kim HG, Hien TT, Han EH, Hwang YP, Choi JH, Kang KW, Kwon KI, Kim BH, Kim SK, Song GY, Jeong TC, Jeong HG. Metformin inhibits P-glycoprotein expression via the NF-kappaB pathway and CRE transcriptional activity through AMPK activation. Br J Pharmacol. 2011;162:1096–1108. doi: 10.1111/j.1476-5381.2010.01101.x. [DOI] [PMC free article] [PubMed] [Google Scholar]
- 34.Kim TH, Suh DH, Kim MK, Song YS. Metformin against cancer stem cells through the modulation of energy metabolism: special considerations on ovarian cancer. Biomed Res Int. 2014;2014:132702. doi: 10.1155/2014/132702. [DOI] [PMC free article] [PubMed] [Google Scholar]
- 35.Zaidi S, Gandhi J, Joshi G, Smith NL, Khan SA. The anticancer potential of metformin on prostate cancer. Prostate Cancer Prostatic Dis. 2019;22:351–361. doi: 10.1038/s41391-018-0085-2. [DOI] [PubMed] [Google Scholar]
Associated Data
This section collects any data citations, data availability statements, or supplementary materials included in this article.


