
Figure 1.
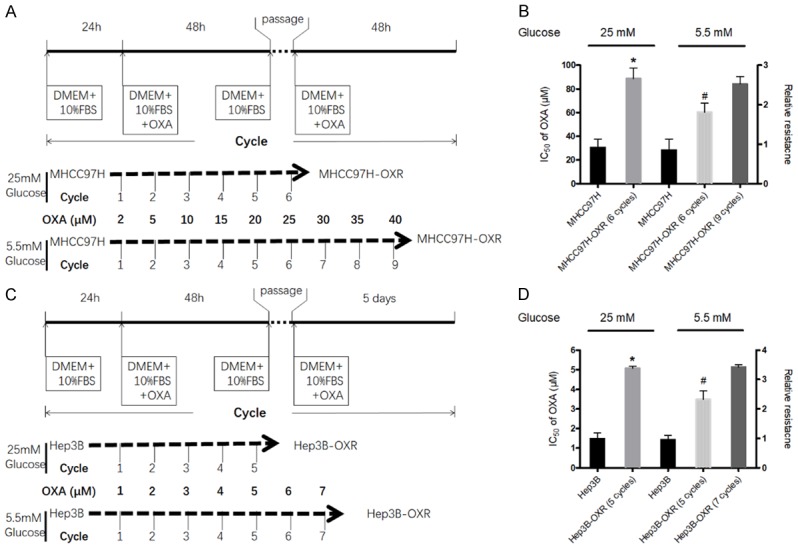
HCC cells underwent the alteration of metabolic phenotype during resistance to OXA. A and C: The procedure of establishing OXA-resistant MHCC97H (MHCC97H-OXR) and Hep3B (Hep3B-OXR) cells. The detail description can be found in the METHODS section. B and D: The IC50s for OXA in MHCC97H vs MHCC97H-OXR cells and Hep3B vs Hep3B-OXR cells in AG (25 mM) and LG (5.5 mM) condition. The left longitudinal axis means the IC50 for OXA; the right longitudinal axis indicates relative resistance based on the definition of HCC cells in AG condition as 1.0. All values represent the mean of three independent experiments.