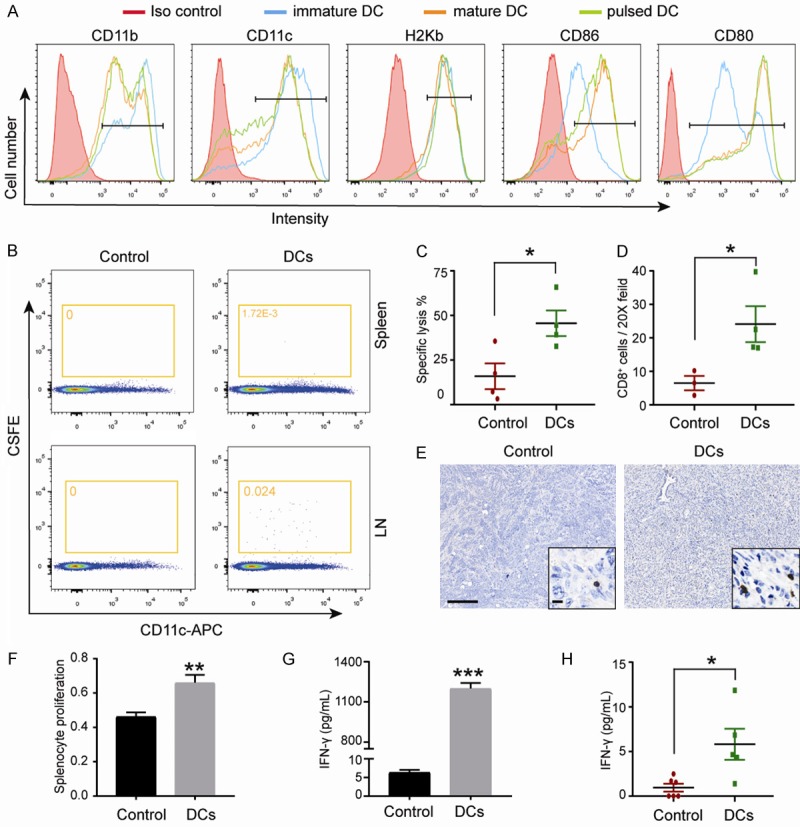
Figure 1.

Vaccination with KPC pulsed DCs resulted an antitumor T-cell response in KPC mice. (A) Flow cytometry for analyzing levels of surface proteins in immature dendritic cells (DC), mature DC or KPC loaded DC. A representative example of three independent experiments is shown. (B) Representative scatter plots of migrated DCs in the spleen and lymph node are shown. For DCs group, the spleen and pancreatic LN from the DCs treated mice were used. For control group, ndLN (inguinal) from the DCs treated mice and the spleen from untreated mice were used. (Representative experiment, n = 3). (C) In vivo CTLs assay. Naïve splenocytes were labeled with 20 × diluted CFSE (left peaks) or with CFSE (right peaks) and pulsed with UV-KPC cells, as target cells. Target cells at 5 × 10⁶ were injected intravenously into the recipient mice 3-5 days after treatment. Splenocytes were collected from the recipient mice for detection of CFSE-labeled cells by flow cytometry at 16 hours. Quantitation of specific lysis are shown (n = 4). (D) Representative images of tumor infiltrating CD8+ T cells. Scale bars represent 200 μm (inset, 25 μm) and (E) quantification are shown (n = 4). (F) Results of the proliferation of splenocytes. Spleen cells obtained from treated mice were co-cultured with UV-KPC, and the cell proliferation was evaluated by a CCK-8 kit assay. (G) Measurement of IFN-γ in serum from treated mice on day 4 after the last treatment (n = 5-6). (H) The production of IFN-γ in the culture supernatants. Splenocytes of surviving mice (DC treatment group and control group), were isolated when the mice were sacrificed and cultured in the presence of KPC tumor cells. Data were combined from three experiments. *P < 0.05, **P < 0.001. Data are expressed as the mean ± SEM.
