Figure 4.
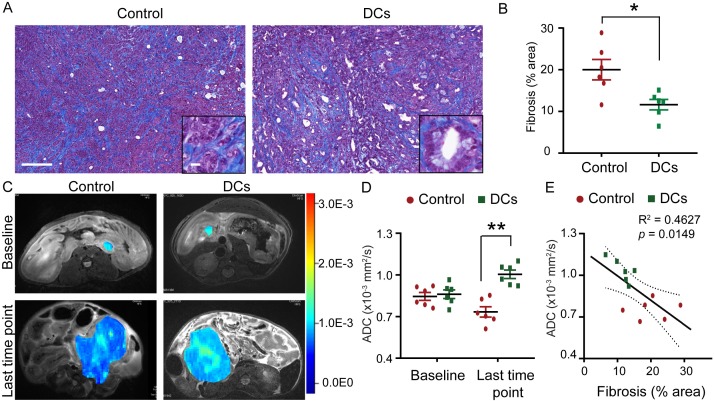
DC vaccine decreased fibrosis in KPC tumor. A. Representative images of trichrome staining for collagen connective tissue deposition in PDAC from treated and control KPC genetic model of PDAC. Scale bars represent 200 μm (inset, 25 μm). B. Relative quantification of collagen stained area for each group. n = 6; *P < 0.05. C. Representative ADC pseudocolor maps of the tumor overlaid onto a T2-weighted image from KPC genetic model of PDAC in treated and control cohorts are shown. D. ADC values measured from KPC genetic model of PDAC in treated and control groups at baseline and last time point. n = 6; **P < 0.001. E. Linear correlation analyses between ADC values and histology measurement of fibrosis area. R2 = 0.46, P = 0.015. Data are expressed as the mean ± SEM.

