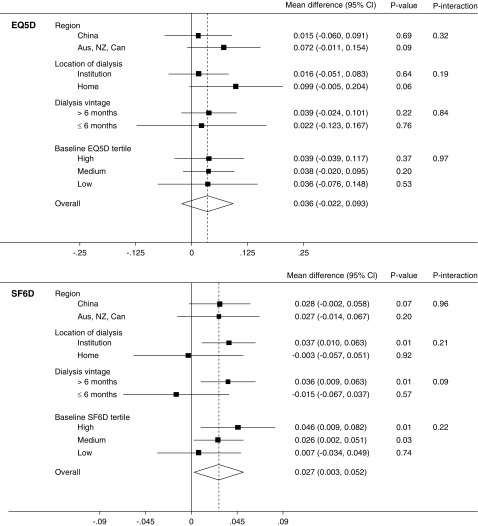
Figure 2.
Effect of extended hours dialysis on health utility by subgroups. Mean difference between treatment groups from linear mixed effects model of health utility and subgroup, adjusted by time point and baseline score and with an interaction between subgroup and treatment group. Zero represents no effect of the intervention, positive values reflect benefit. Aus, Australia; Can, Canada; NZ, New Zealand; EQ5D, EuroQOL-5 Dimension-3 Level; SF6D, Short-Form 6-Dimension.

