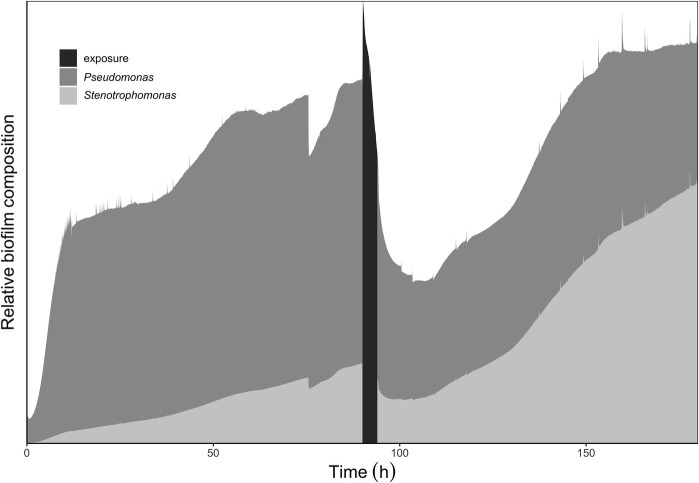
Figure 6.
Relative abundance of Pseudomonas to Stenotrophomonas within the multispecies biofilm at various time points in biofilm growth. The data used for the schematic representation were genus distributions annotated from the metagenomes submitted to mg-RAST. The metagenomic samples taken had percentage (%) bacterial compositions (Pseudomonas: Stenotrophomonas) as follows: initial inoculum 97:1; steady-state biofilm and pre-exposure biofilm effluent: 70:20; post-exposure effluent 18:65. The schematic shows an increase in Stenotrophomonas in the population following inoculation and biofilm development. Following the antibiotic exposure the relative abundance of Stenotrophomonas is seen to shift again; reflecting the effluent sample taken following recovery after the antibiotic exposure.

