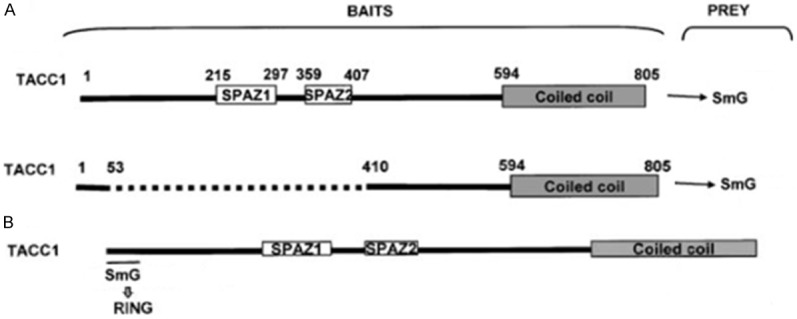
Figure 8.

Mapping of TACC1/SNRPG interactions using the two-hybrid method in yeast. A. Schematic representation of TACC1 protein showing its three different regions: N-terminus, central serine/proline-rich region with two SPAZ motifs and coiled-coil C-terminus. Below are the different fragments generated as baits. B. Results of the mapping showing SNRPG binding to the N-terminus region of TACC1 in yeast two-hybrid experiments (Figure taken from [16]).
